Fig. B.2
Download original image
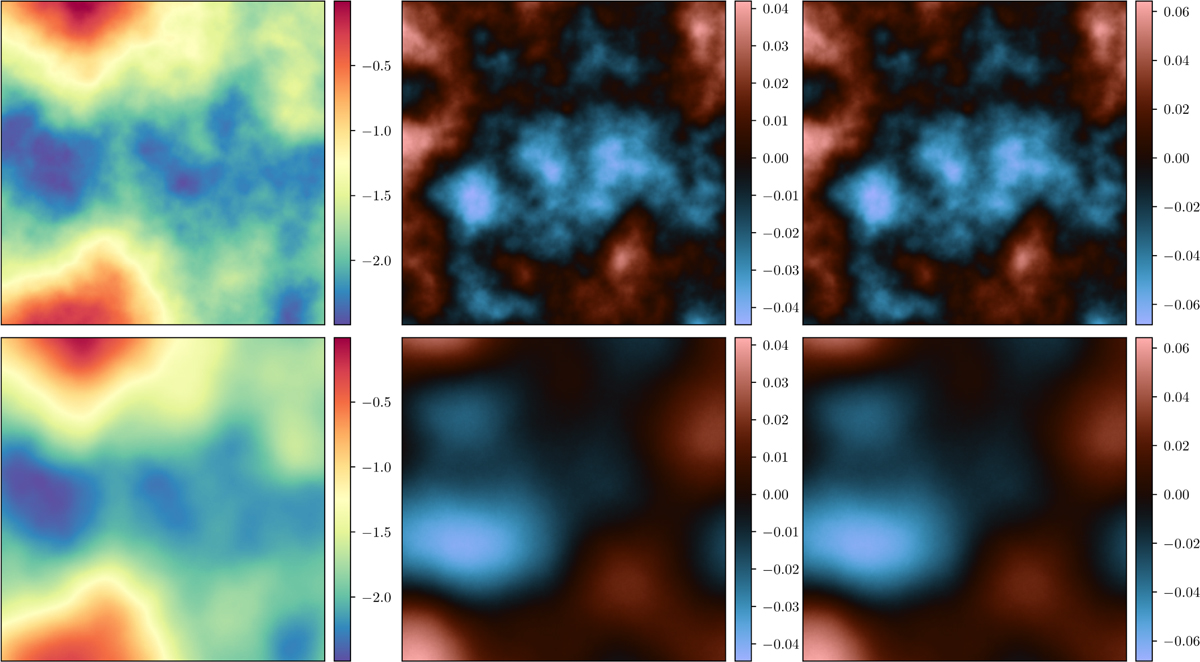
Spectral reconstruction from the synthetic multifrequency imaging example from Sec. 2.5. The top row shows the ground truth spectral index map α(x) (left panels) and spectral deviations log Iδ(x, ν) as defined in Eq. (6). The central panels represent the spectral fluctuations at νlow and the right ones at νhi. The bottom row presents the corresponding posterior mean reconstructions. These highlight the method’s ability to recover both large-scale spectral slopes and localized deviations across the frequency range.
Current usage metrics show cumulative count of Article Views (full-text article views including HTML views, PDF and ePub downloads, according to the available data) and Abstracts Views on Vision4Press platform.
Data correspond to usage on the plateform after 2015. The current usage metrics is available 48-96 hours after online publication and is updated daily on week days.
Initial download of the metrics may take a while.