Fig. 2
Download original image
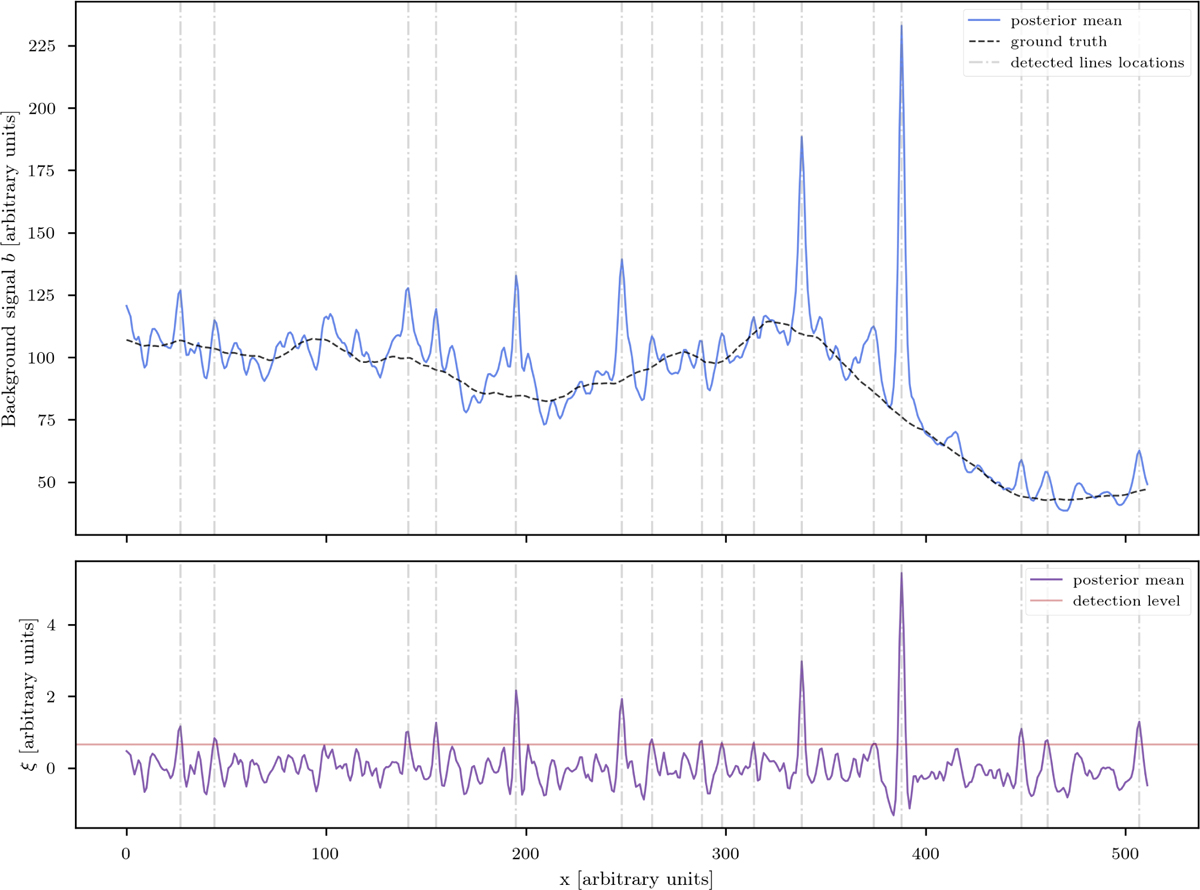
Background-only reconstruction. The top panel displays the posterior mean of the background-only reconstruction (solid blue line) in comparison to the ground truth background signal response (dashed black line). The bottom panel shows corresponding latent position-space excitations ξ (purple solid line). The detection level for the line component was set to σthresh = 0.6 in prior units and it is displayed in red (solid horizontal line). The detected line positions for the given threshold σthresh are displayed as dashed vertical gray lines in both panels.
Current usage metrics show cumulative count of Article Views (full-text article views including HTML views, PDF and ePub downloads, according to the available data) and Abstracts Views on Vision4Press platform.
Data correspond to usage on the plateform after 2015. The current usage metrics is available 48-96 hours after online publication and is updated daily on week days.
Initial download of the metrics may take a while.