Fig. D.1
Download original image
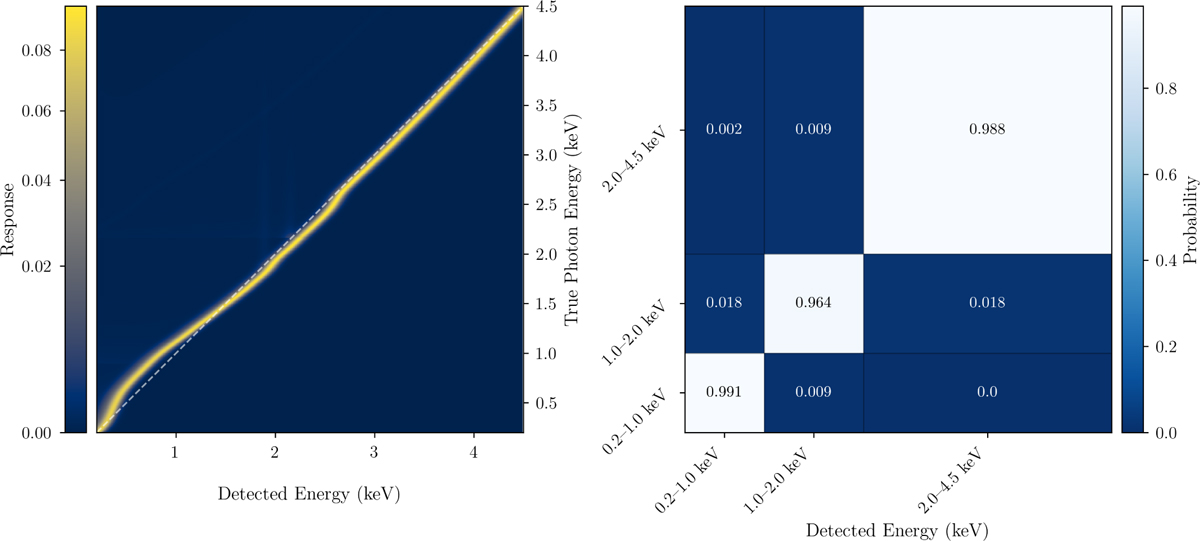
Response matrix file (RMF) of the eROSITA telescope for telescope module TM1. Left: Full-resolution RMF in the 0.2 keV to 4.5 keV range, showing the probability distribution of detected energies (horizontal axis) for incident photon energies (vertical axis). The dashed white line marks the ideal one-to-one relation Etrue = Edet. Right: The same response integrated into three broad bands (0.2 keV to 1.0 keV, 1.0 keV to 2.0 keV, and 2.0 keV to 4.5 keV), yielding a 3 × 3 representation of the energy redistribution. Cell values indicate normalized detection probabilities, and grid lines mark the bin boundaries. The nearly diagonal structure demonstrates that spectral bleeding is negligible for the purposes of this work.
Current usage metrics show cumulative count of Article Views (full-text article views including HTML views, PDF and ePub downloads, according to the available data) and Abstracts Views on Vision4Press platform.
Data correspond to usage on the plateform after 2015. The current usage metrics is available 48-96 hours after online publication and is updated daily on week days.
Initial download of the metrics may take a while.