Fig. 3
Download original image
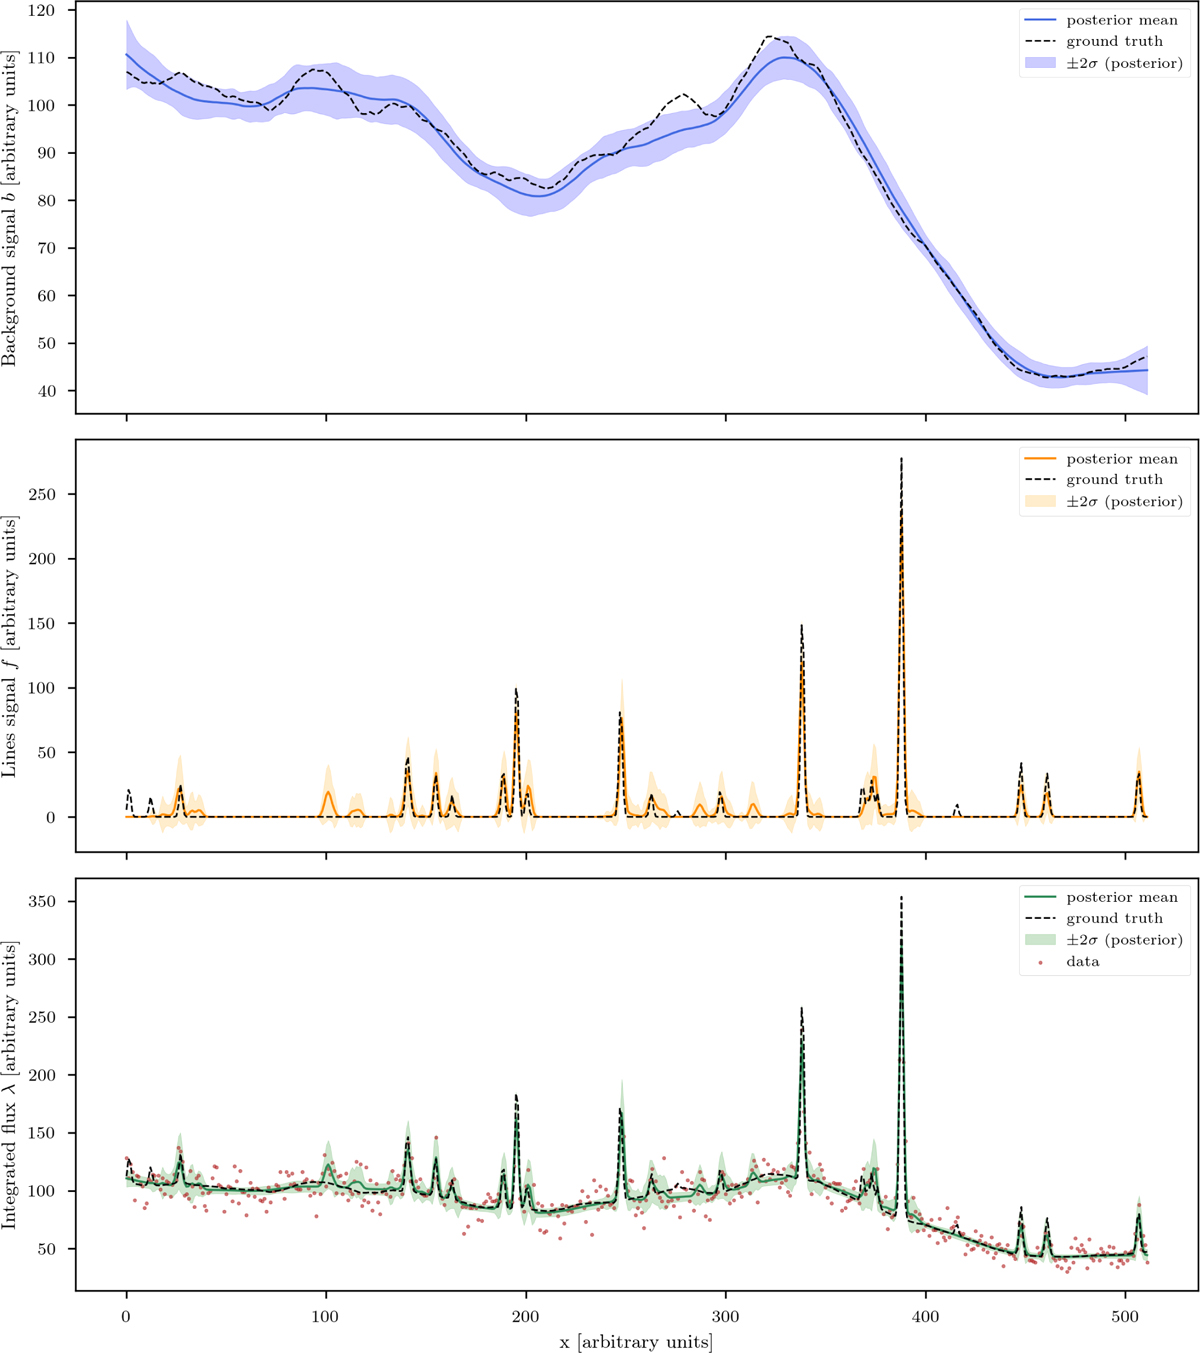
Results of one-dimensional automatic component modeling method. The top panel displays the posterior mean of the background component b (solid blue line) in comparison to the ground truth background signal (dashed black line). The central panel depicts the posterior mean of the line component f (solid orange line) in comparison to the ground truth line signal (dashed black line). The bottom panel shows the posterior mean of the total signal s (solid green line) in comparison to the ground truth signal (dashed black line). The data is also shown in red. Shaded regions denote the ±2σ posterior contours for each component in the respective panels.
Current usage metrics show cumulative count of Article Views (full-text article views including HTML views, PDF and ePub downloads, according to the available data) and Abstracts Views on Vision4Press platform.
Data correspond to usage on the plateform after 2015. The current usage metrics is available 48-96 hours after online publication and is updated daily on week days.
Initial download of the metrics may take a while.