Fig. 5
Download original image
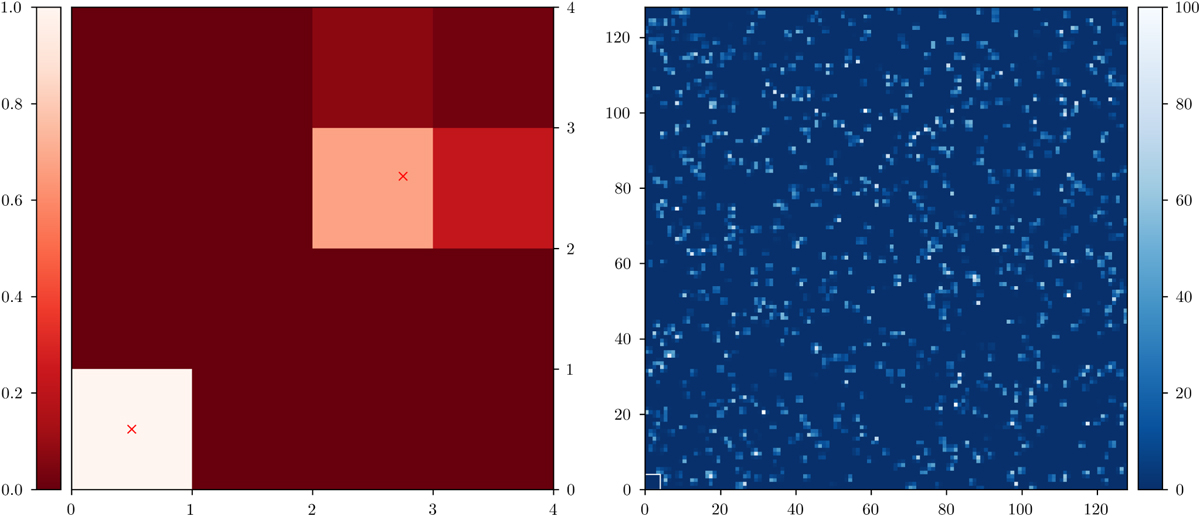
Interpolation of the point-source field flux onto a regular pixel grid. The left panel shows the interpolation result for two, unit-flux point sources located at (0.5, 0.5) (center of the pixel) and at (2.75, 2.6) on a 4 × 4 pixel grid. The location of the point sources is marked with a red cross. The right panel displays a random realization of 1000 uniformly distributed point sources on a 128 × 128 pixel grid with flux values uniformly distributed between 0 and 100. A white rectangle in the lower-left corner indicates a region of the same size as that shown in the left panel, providing a spatial scale reference.
Current usage metrics show cumulative count of Article Views (full-text article views including HTML views, PDF and ePub downloads, according to the available data) and Abstracts Views on Vision4Press platform.
Data correspond to usage on the plateform after 2015. The current usage metrics is available 48-96 hours after online publication and is updated daily on week days.
Initial download of the metrics may take a while.