Fig. 6
Download original image
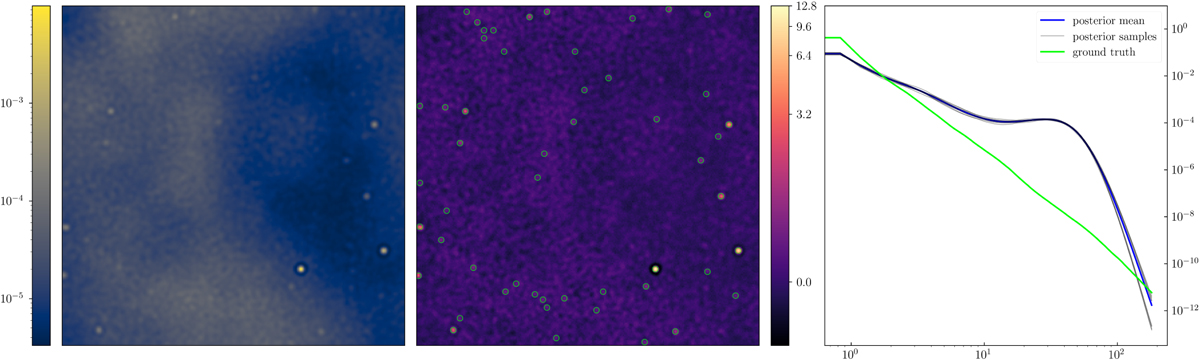
Result of background-only reconstruction. Left: posterior mean of the reconstructed background field after two geoVI iterations. Artifacts at the point-source length scale are visible (low-flux coronas around the point sources, wiggles in the diffuse field). Center: position-space excitation field ξ after two geoVI iterations. Detected point-source candidates above the ξ = 0.65 threshold are circled in lime. Right: reconstructed spatial power spectrum. The posterior mean is shown in blue, posterior samples in gray, and the ground truth in lime.
Current usage metrics show cumulative count of Article Views (full-text article views including HTML views, PDF and ePub downloads, according to the available data) and Abstracts Views on Vision4Press platform.
Data correspond to usage on the plateform after 2015. The current usage metrics is available 48-96 hours after online publication and is updated daily on week days.
Initial download of the metrics may take a while.