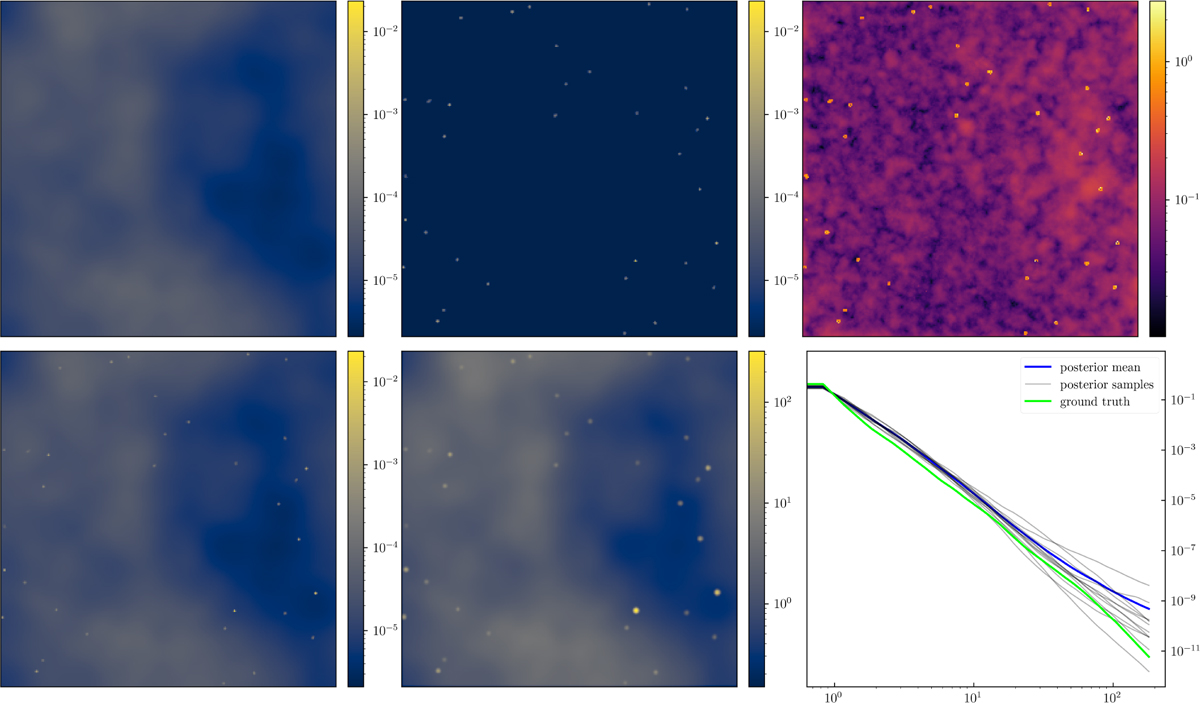
Fig. 7
Download original image
Results of synthetic component separation example for imaging. The top row shows the reconstructed (posterior mean) diffuse-field emission (left), the reconstructed point-source component (middle), and the relative uncertainty of the sky reconstruction (right), defined as the posterior sample standard deviation divided by the posterior mean. Notably, the relative uncertainty is highest at locations containing point sources, as individual posterior samples place them at slightly different positions due to the inferred positional uncertainty. The bottom row presents the reconstructed sky emission as the sum of the diffuse and point-source components (left), the convolved and exposure-multiplied reconstructed sky emission (middle), and a comparison of the reconstructed spatial power spectrum (posterior mean in blue, posterior samples in gray) with the ground truth power spectrum (in lime, right).
Current usage metrics show cumulative count of Article Views (full-text article views including HTML views, PDF and ePub downloads, according to the available data) and Abstracts Views on Vision4Press platform.
Data correspond to usage on the plateform after 2015. The current usage metrics is available 48-96 hours after online publication and is updated daily on week days.
Initial download of the metrics may take a while.