Fig. 2.
Download original image
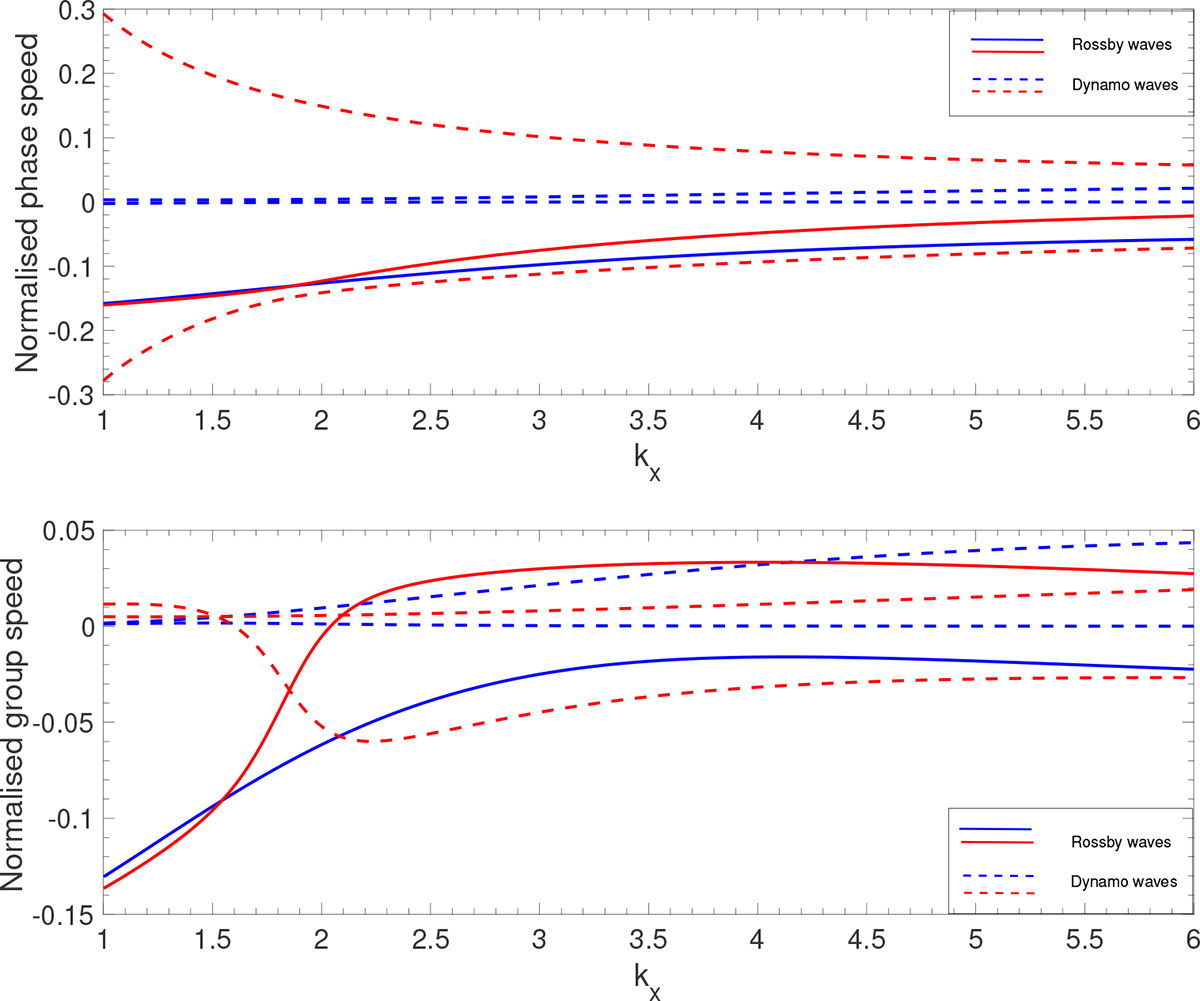
Phase (ω/kx, upper panel) and group (∂ω/∂kx, lower panel) speeds of Rossby-dynamo waves vs toroidal wavenumber for the toroidal magnetic field strength of 10 kG at the latitude 300 of the solar tachocline according to Eq. (16). The negative (positive) speeds correspond to the retrograde (prograde) propagation. The speeds are normalized by the tachocline rotation speed ΩR, where Ω = 2.9 × 10⁻⁶ rad s−1 is the sidereal angular velocity and R ∼ 5 × 1010 cm is the distance from the solar center. The toroidal wavenumber kx is normalized by R. Blue and red lines indicate the phase and group speeds for the dynamo coefficient, αz (normalized by Ω), as 0.003 and 0.3, respectively. The dimensionless value of the surface gravity speed, ![]() , where g is the reduced gravity and H = 107 m is the thickness of the overshoot layer, here is equal to 0.33. The reduced gravity is related with the fractional deference between actual and adiabatic temperature gradients, δ, as gH/Ω2R2 ∼ 103δ ∼ 103|∇ − ∇ad|, where ∇ = dlnT/dlnP and ∇ad = (∂lnT/∂lnP)ad. The high frequency inertia gravity waves are not shown in these plots. We note that the group speeds of Rossby and dynamo waves reverse the propagation for higher value of dynamo coefficient (red lines): one of the dynamo waves changes from prograde to retrograde propagation at kx ∼ 1.5 and the Rossby wave changes from the retrograde to the prograde propagation at kx ∼ 2. Here ky = 0 is taken during computation.
, where g is the reduced gravity and H = 107 m is the thickness of the overshoot layer, here is equal to 0.33. The reduced gravity is related with the fractional deference between actual and adiabatic temperature gradients, δ, as gH/Ω2R2 ∼ 103δ ∼ 103|∇ − ∇ad|, where ∇ = dlnT/dlnP and ∇ad = (∂lnT/∂lnP)ad. The high frequency inertia gravity waves are not shown in these plots. We note that the group speeds of Rossby and dynamo waves reverse the propagation for higher value of dynamo coefficient (red lines): one of the dynamo waves changes from prograde to retrograde propagation at kx ∼ 1.5 and the Rossby wave changes from the retrograde to the prograde propagation at kx ∼ 2. Here ky = 0 is taken during computation.
Current usage metrics show cumulative count of Article Views (full-text article views including HTML views, PDF and ePub downloads, according to the available data) and Abstracts Views on Vision4Press platform.
Data correspond to usage on the plateform after 2015. The current usage metrics is available 48-96 hours after online publication and is updated daily on week days.
Initial download of the metrics may take a while.