Fig. 8
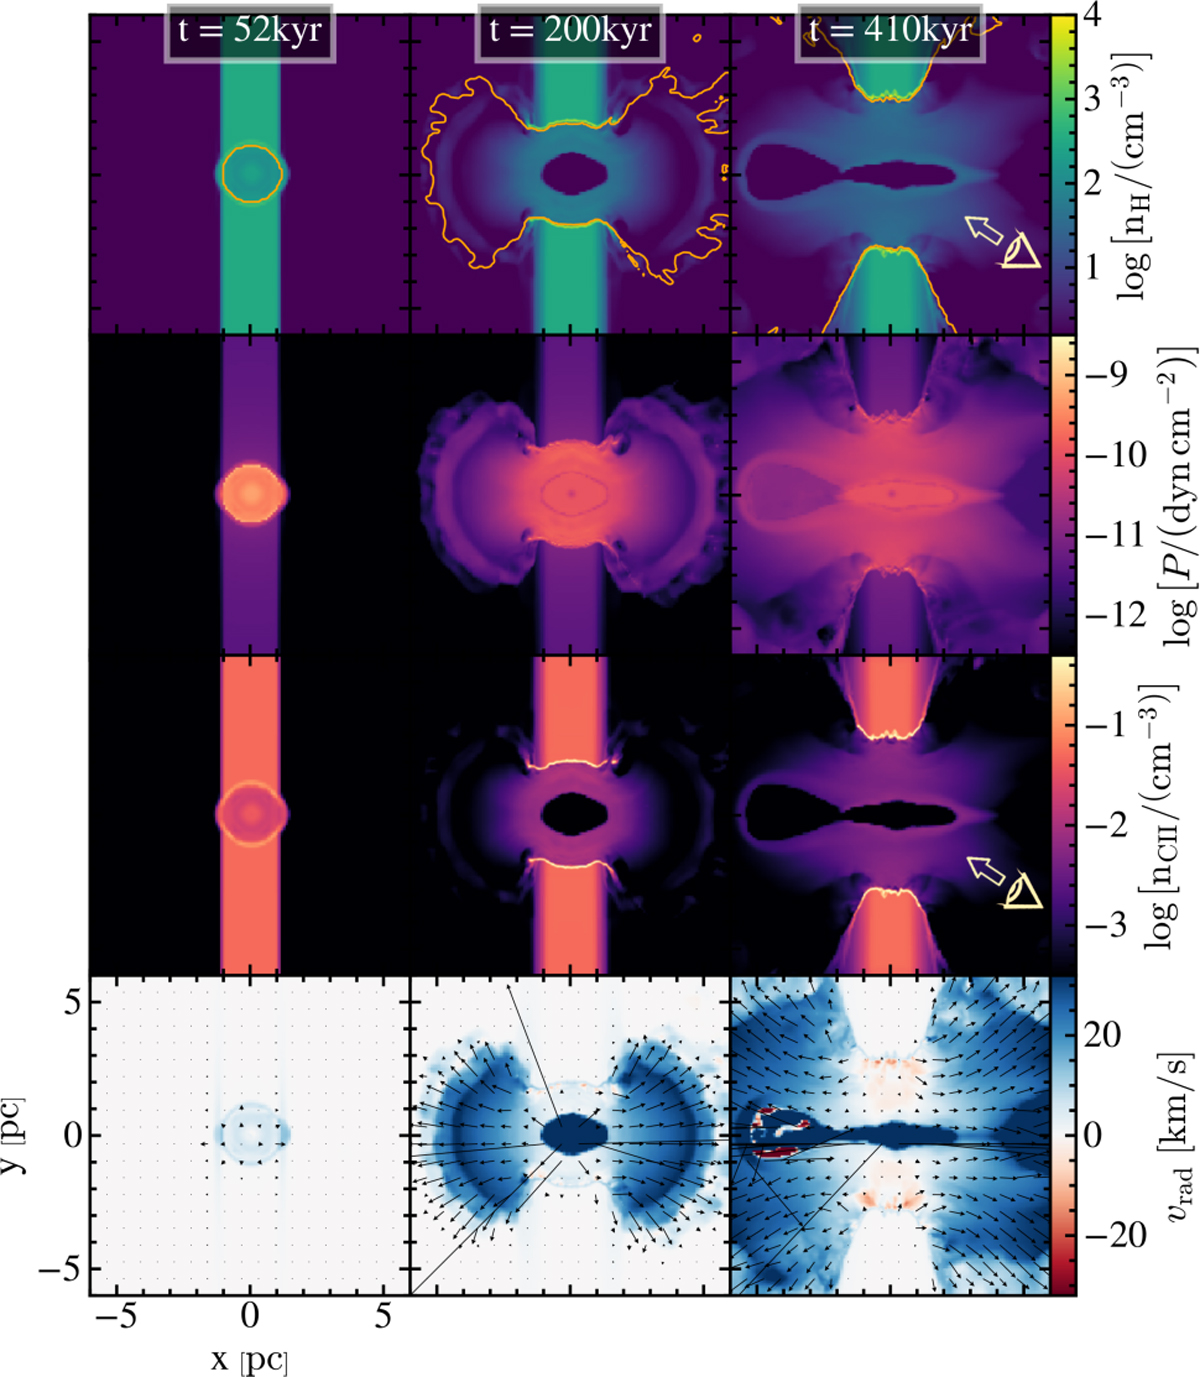
Download original image
Slices of the central 12 pc × 12 pc of a simulation with stellar wind of the total hydrogen number density, pressure, [C II] number density, and radial velocity for three time steps. The full simulation box is further elongated along the x-direction to capture the propagation of the fast bipolar outflow. The time evolution is shown from left to right. The orange contour marks the position of the ionization front and the black arrows show the direction of the gas velocity. The direction with an inclination of 34° from which the DR is observed is indicated in two panels. An animated version of the first and third panel can be found online.
Current usage metrics show cumulative count of Article Views (full-text article views including HTML views, PDF and ePub downloads, according to the available data) and Abstracts Views on Vision4Press platform.
Data correspond to usage on the plateform after 2015. The current usage metrics is available 48-96 hours after online publication and is updated daily on week days.
Initial download of the metrics may take a while.