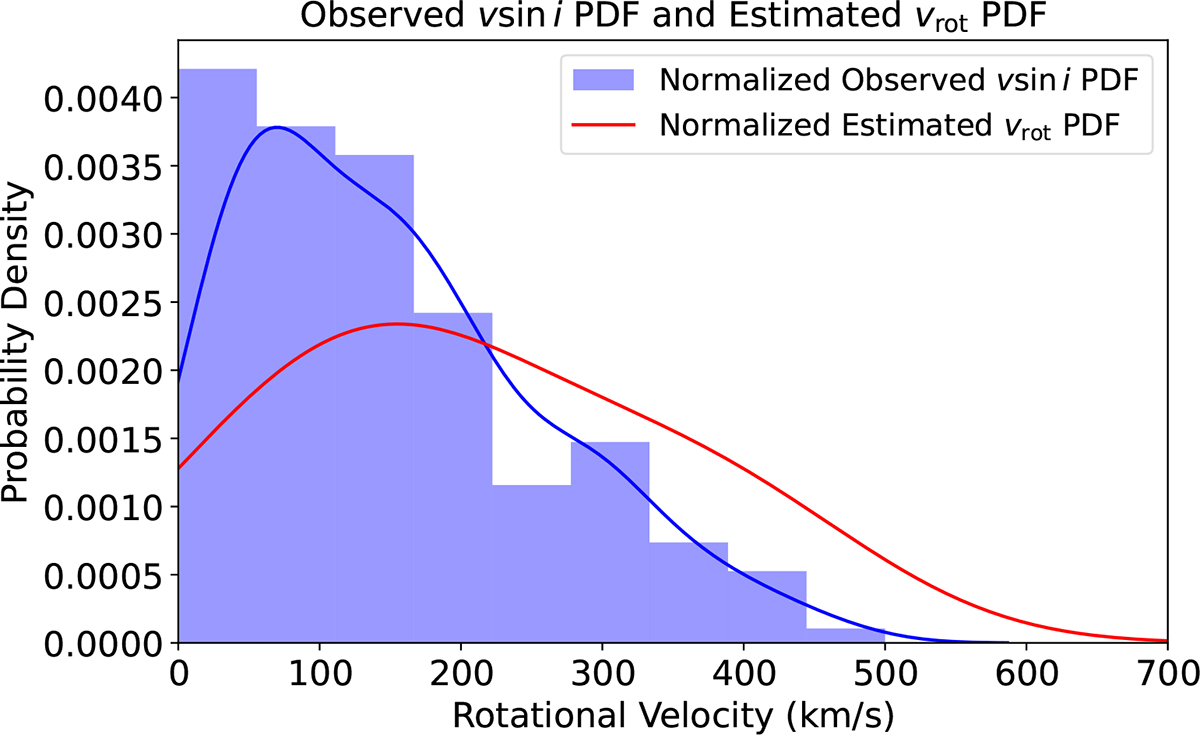
Fig. 2.
Download original image
Velocity distribution of O-type stars in the SMC. The plot shows the normalized observed v sin i distribution (blue) and the reconstructed initial rotational velocity (vrot, red) for 171 O-type stars. The dataset is a compilation from Ramachandran et al. (2019), Rickard et al. (2024), and Bestenlehner et al. (2025). About 10% of the O-type stars feature vrot > 450 km/s.
Current usage metrics show cumulative count of Article Views (full-text article views including HTML views, PDF and ePub downloads, according to the available data) and Abstracts Views on Vision4Press platform.
Data correspond to usage on the plateform after 2015. The current usage metrics is available 48-96 hours after online publication and is updated daily on week days.
Initial download of the metrics may take a while.