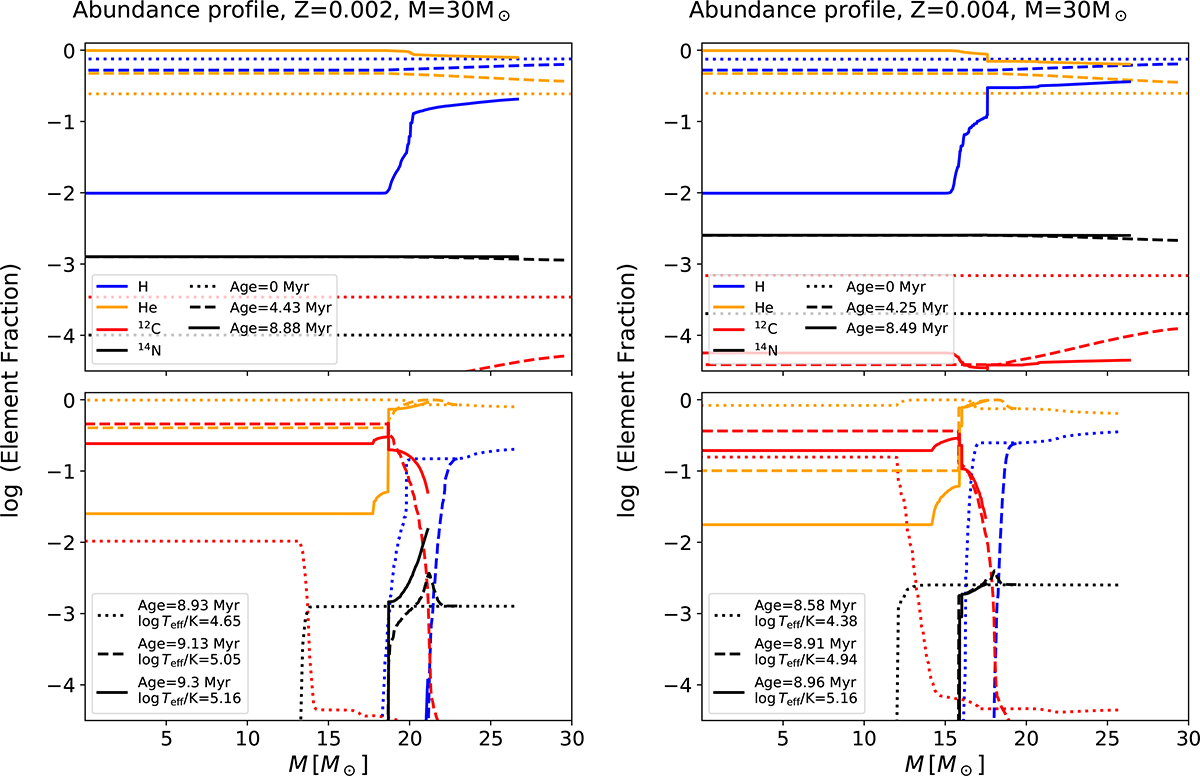
Fig. D.1.
Download original image
Stellar profiles for a 30 M⊙ star. Abundances of hydrogen (blue), helium (orange), 12C (red), and 14N (black) as a function of the mass enclosed in a given shell. Left panels are for Z = 0.002, right for Z = 0.004. Top panels: main sequence evolution. Line styles are for different times: dotted for ZAMS, dashed for half main sequence, solid for end of the main sequence. Bottom panels: post main sequence phases. Line styles are for different times: dotted for the time corresponding to minimum temperature, dashed for log(Teff/K)∼5, solid for log(Teff/K)∼5.15.
Current usage metrics show cumulative count of Article Views (full-text article views including HTML views, PDF and ePub downloads, according to the available data) and Abstracts Views on Vision4Press platform.
Data correspond to usage on the plateform after 2015. The current usage metrics is available 48-96 hours after online publication and is updated daily on week days.
Initial download of the metrics may take a while.