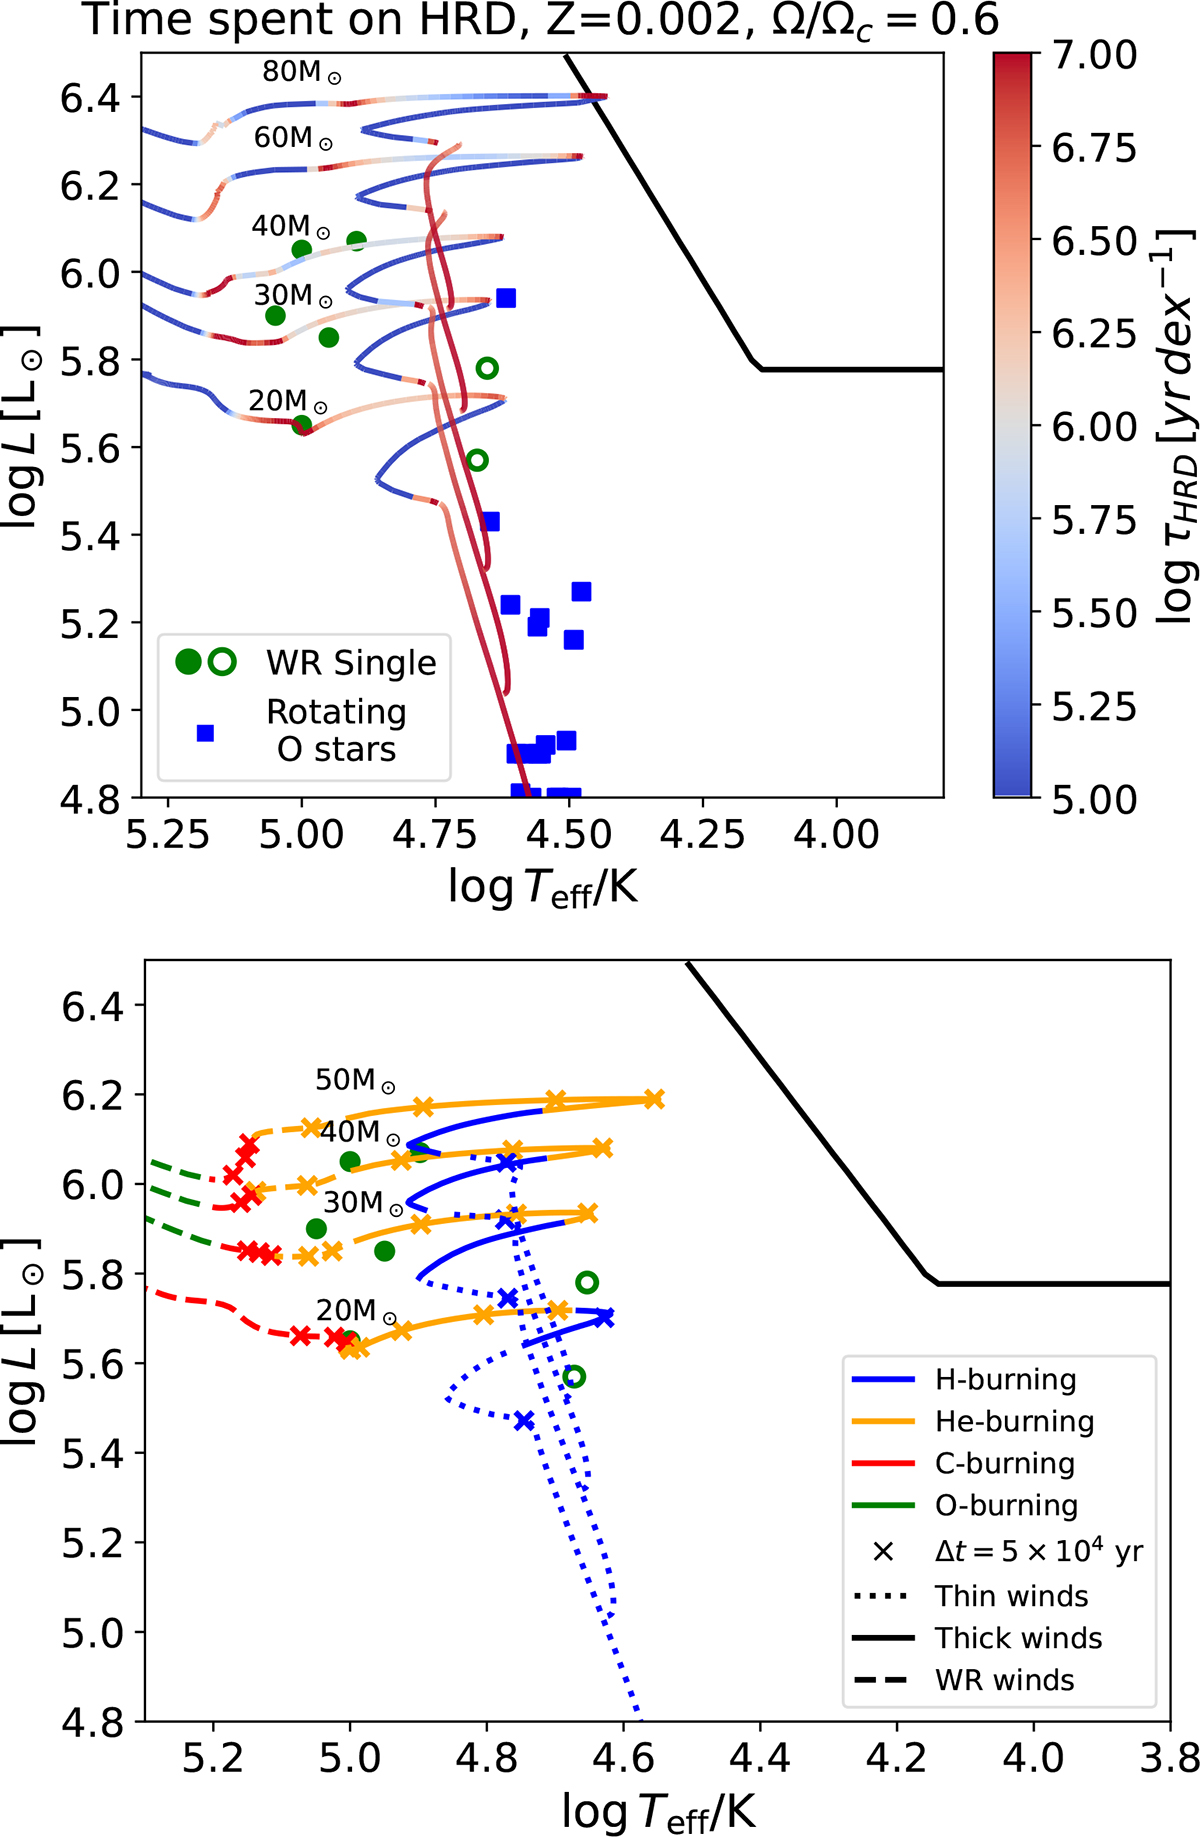
Fig. 5.
Download original image
Time spent on different regions of the HR diagram for stars with mass M = 20, 30, 40, 60, and 80 M⊙ at Z = 0.002 and Ω/Ωc = 0.6. In the upper panel, the color code represents the quantity τHRD, in yr dex−1, which is the time spent to move by 1 dex in the HR diagram. Green circles are WRs in the SMC ,and blue squares are O-type stars in the SMC with v sin i > 200 km/s from (Mokiem et al. 2006; Bouret et al. 2013, 2021; Ramachandran et al. 2019; Dufton et al. 2019; Rickard et al. 2024; Backs et al. 2024). In the lower panel, the color code represents different burning stages: core H-burning (blue), He-burning (orange), carbon burning (red), and oxygen burning (green), while the line styles represent different wind regimes: dotted for optically thin winds, solid for optically thick winds, dashed for WR-type winds. Cross markers are spaced by ∼ 5 × 10⁴ yr each. After the main sequence, stars spend most of their time at the turn-off point, where they start to peel off their H-rich envelope and move blueward, and in the hot WR phase, at 4.9 < log(Teff/K) < 5.2.
Current usage metrics show cumulative count of Article Views (full-text article views including HTML views, PDF and ePub downloads, according to the available data) and Abstracts Views on Vision4Press platform.
Data correspond to usage on the plateform after 2015. The current usage metrics is available 48-96 hours after online publication and is updated daily on week days.
Initial download of the metrics may take a while.