Fig. 1
Download original image
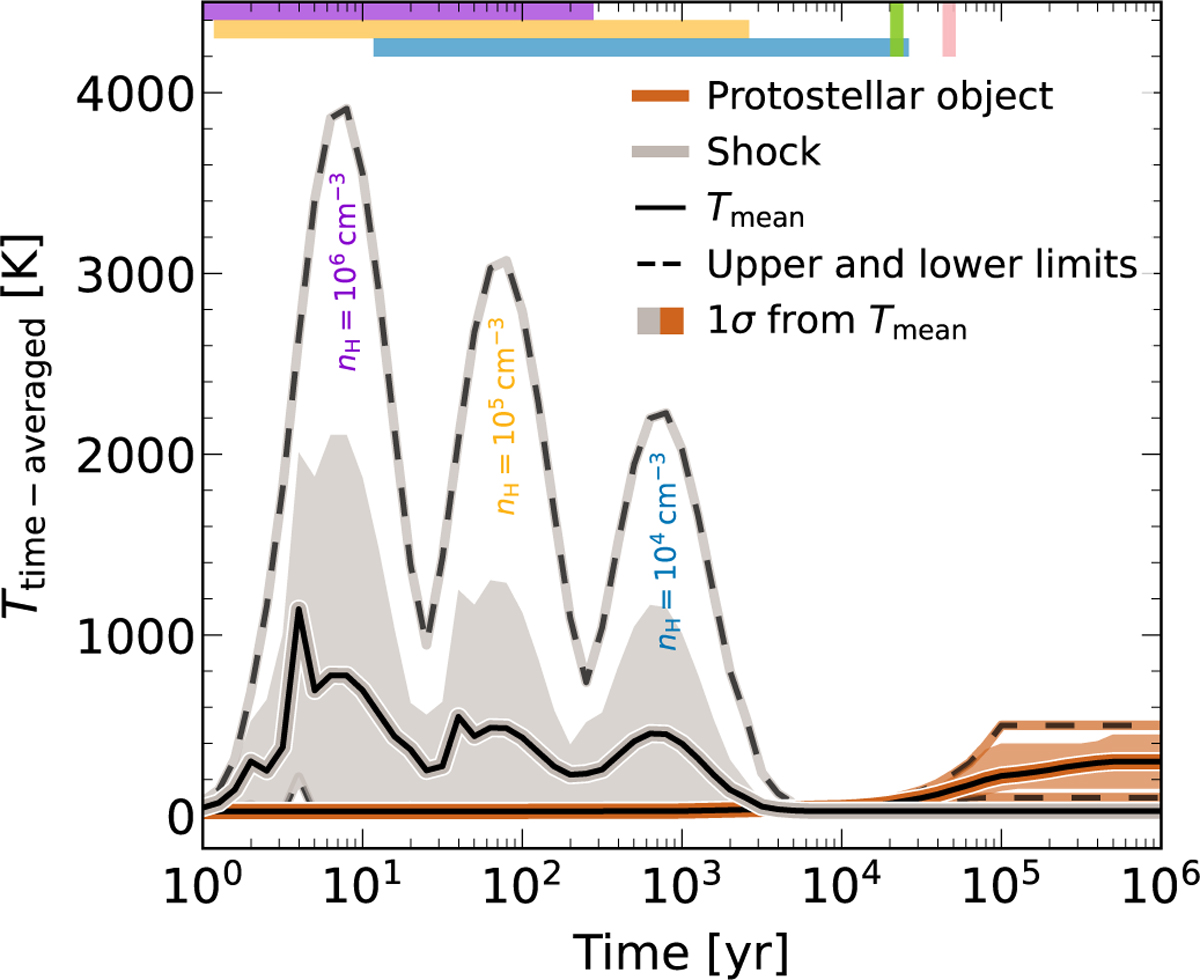
Stage 2 time-averaged temperature profiles for all models of shocks and protostellar objects defined in Table 2. Time-averaged refers to averaging the temperature across all models of a given type at fixed logarithmic time steps. The solid black line represents the mean coupled gas and dust temperature at each logarithmic time step, while the shaded regions indicate the 1σ confidence interval. Dashed lines mark the upper and lower temperature limits. Since these profiles are averaged across all models, multiple shock events appear, though each individual model experiences only one. The timing of each shock event is dictated by the pre-shock medium density, with higher densities leading to shorter timescales, while the temperature is primarily determined by shock velocity. The densities associated with each shock event are annotated, with color-matched rectangular patches at the top of the figure indicating the full possible timing of those events. In contrast, protostellar heating operates on significantly longer timescales. Once the heating stage concludes, the temperature stabilizes at a plateau, set by the maximum protostellar object temperature. Since more massive cores warm up faster, influencing the onset of the temperature plateau, we mark with vertical lines at the top of the figure the earliest plateau onset times: pink for 10 M⊙ objects and green for 25 M⊙.
Current usage metrics show cumulative count of Article Views (full-text article views including HTML views, PDF and ePub downloads, according to the available data) and Abstracts Views on Vision4Press platform.
Data correspond to usage on the plateform after 2015. The current usage metrics is available 48-96 hours after online publication and is updated daily on week days.
Initial download of the metrics may take a while.