Fig. 10
Download original image
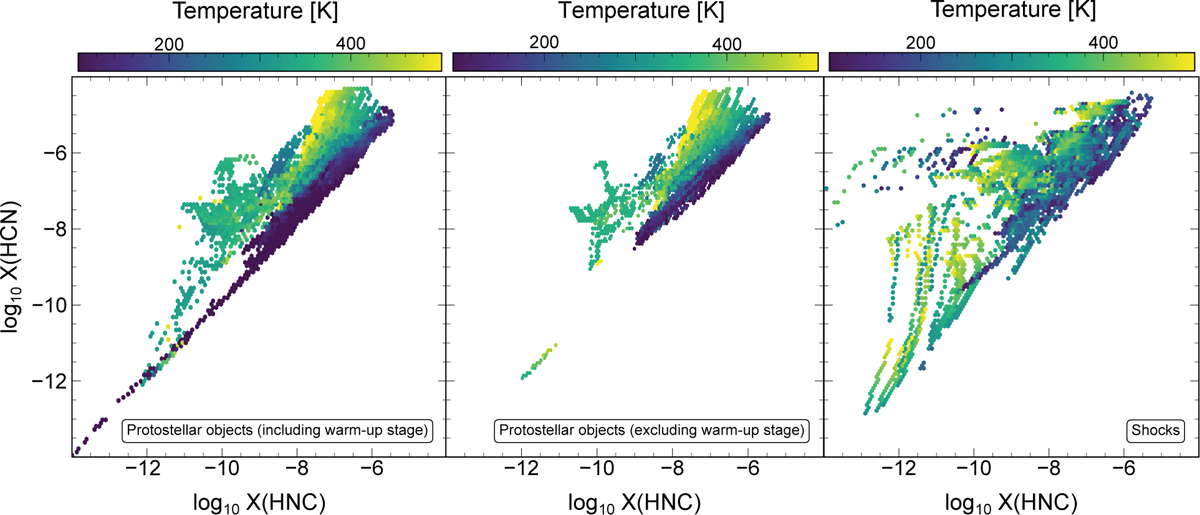
Hexagonal plots comparing the relationship between HNC and HCN abundances, with the mean temperature per hexagonal bin (T) as the color scale, for the models of protostellar objects (left and middle panels) and shocks (right panel). The temperature range is consistently set to 100–500 K in both panels to enable a direct comparison. The color mapping represents the mean temperature within each hexagonal bin, computed using 100 bins for both axes. These figures illustrate how distinct chemical and physical processes shape the HCN-to-HNC ratio, with the ratio serving as a useful temperature tracer in protostellar objects, whereas in shocks, it appears highly variable and less predictive of temperature. The lower-abundance tail in protostellar objects appears to be primarily shaped by the warm-up phase, as illustrated by the contrast between the leftmost and center panels.
Current usage metrics show cumulative count of Article Views (full-text article views including HTML views, PDF and ePub downloads, according to the available data) and Abstracts Views on Vision4Press platform.
Data correspond to usage on the plateform after 2015. The current usage metrics is available 48-96 hours after online publication and is updated daily on week days.
Initial download of the metrics may take a while.