Fig. 11
Download original image
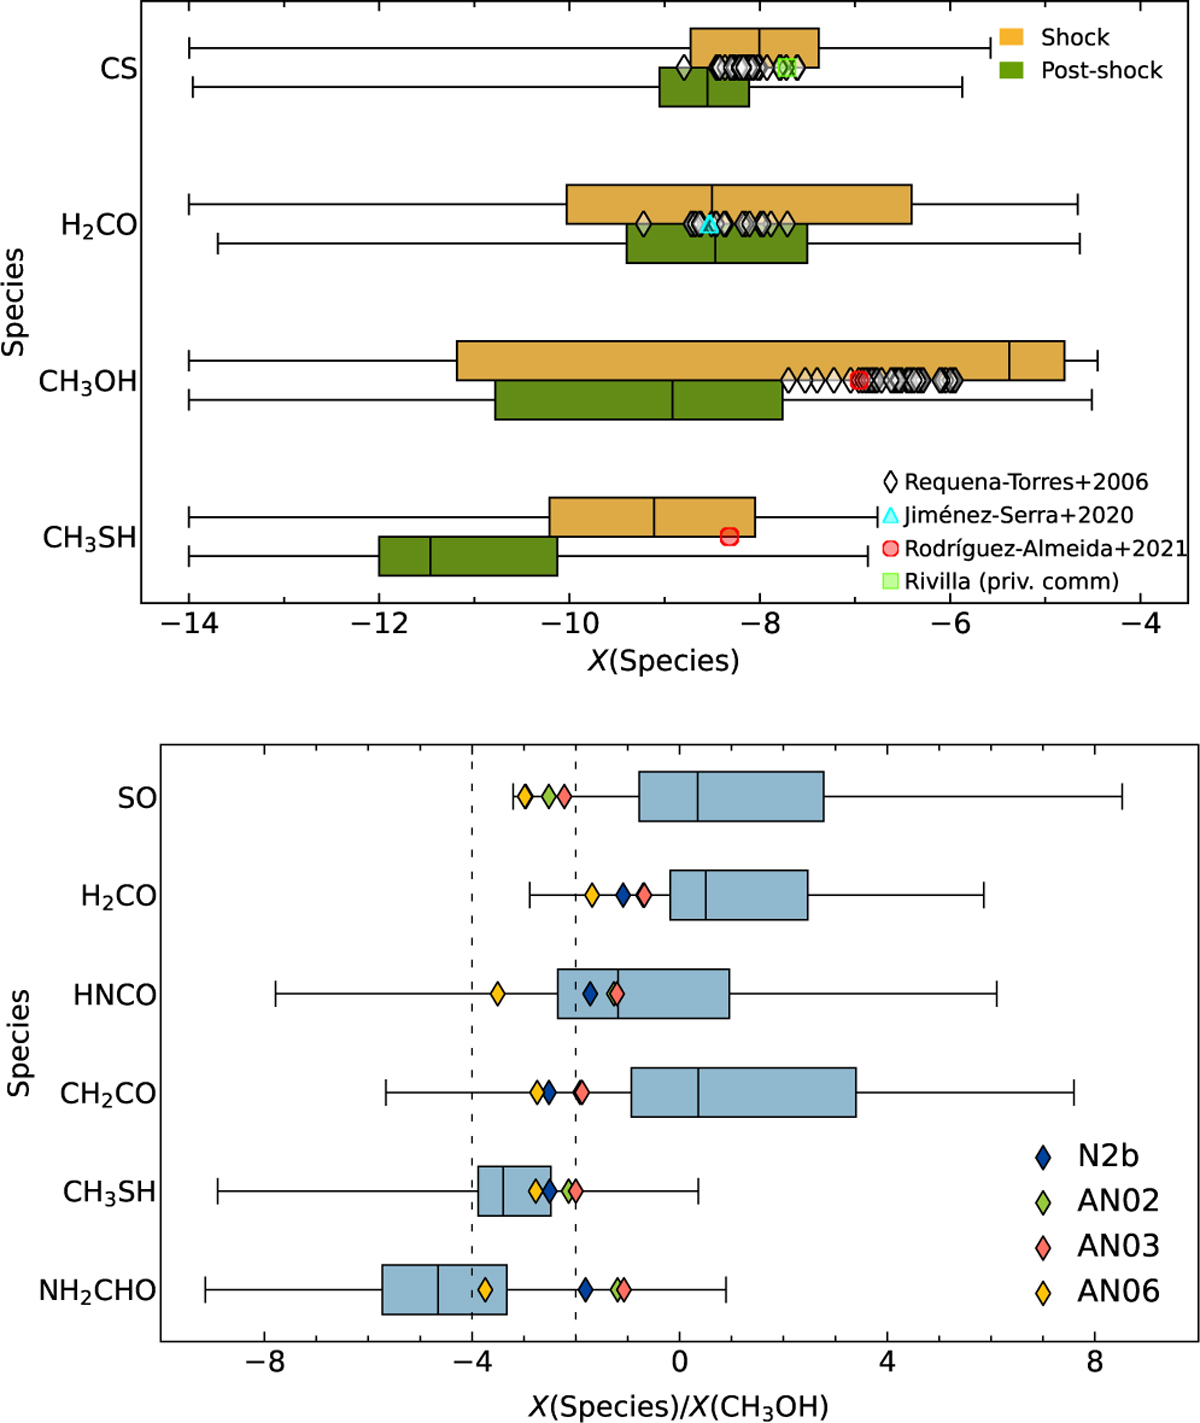
Comparison of modeled abundances with observations toward Galactic Center molecular clouds and the high-mass star-forming region Sgr B2(N2). The top panel shows abundance distributions for shocked (yellow) and post-shocked (green) gas, while the bottom panel presents those for protostellar objects. Shock models are compared with observations of 40 molecular clouds from Requena-Torres et al. (2006), including data toward G+0.693–0.027 for H2CO from Jiménez-Serra et al. (2020), CH3SH and CH3OH from Rodríguez-Almeida et al. (2021), and CS from Rivilla (priv. commun.). Models are also compared with recent data toward Sgr B2(N2) from Belloche et al. (2025). Following Figure 7 in Belloche et al. (2025), modeled protostellar abundances are shown relative to CH3OH, and we indicate the 1% and 0.01% levels with respect to methanol with dashed lines.
Current usage metrics show cumulative count of Article Views (full-text article views including HTML views, PDF and ePub downloads, according to the available data) and Abstracts Views on Vision4Press platform.
Data correspond to usage on the plateform after 2015. The current usage metrics is available 48-96 hours after online publication and is updated daily on week days.
Initial download of the metrics may take a while.