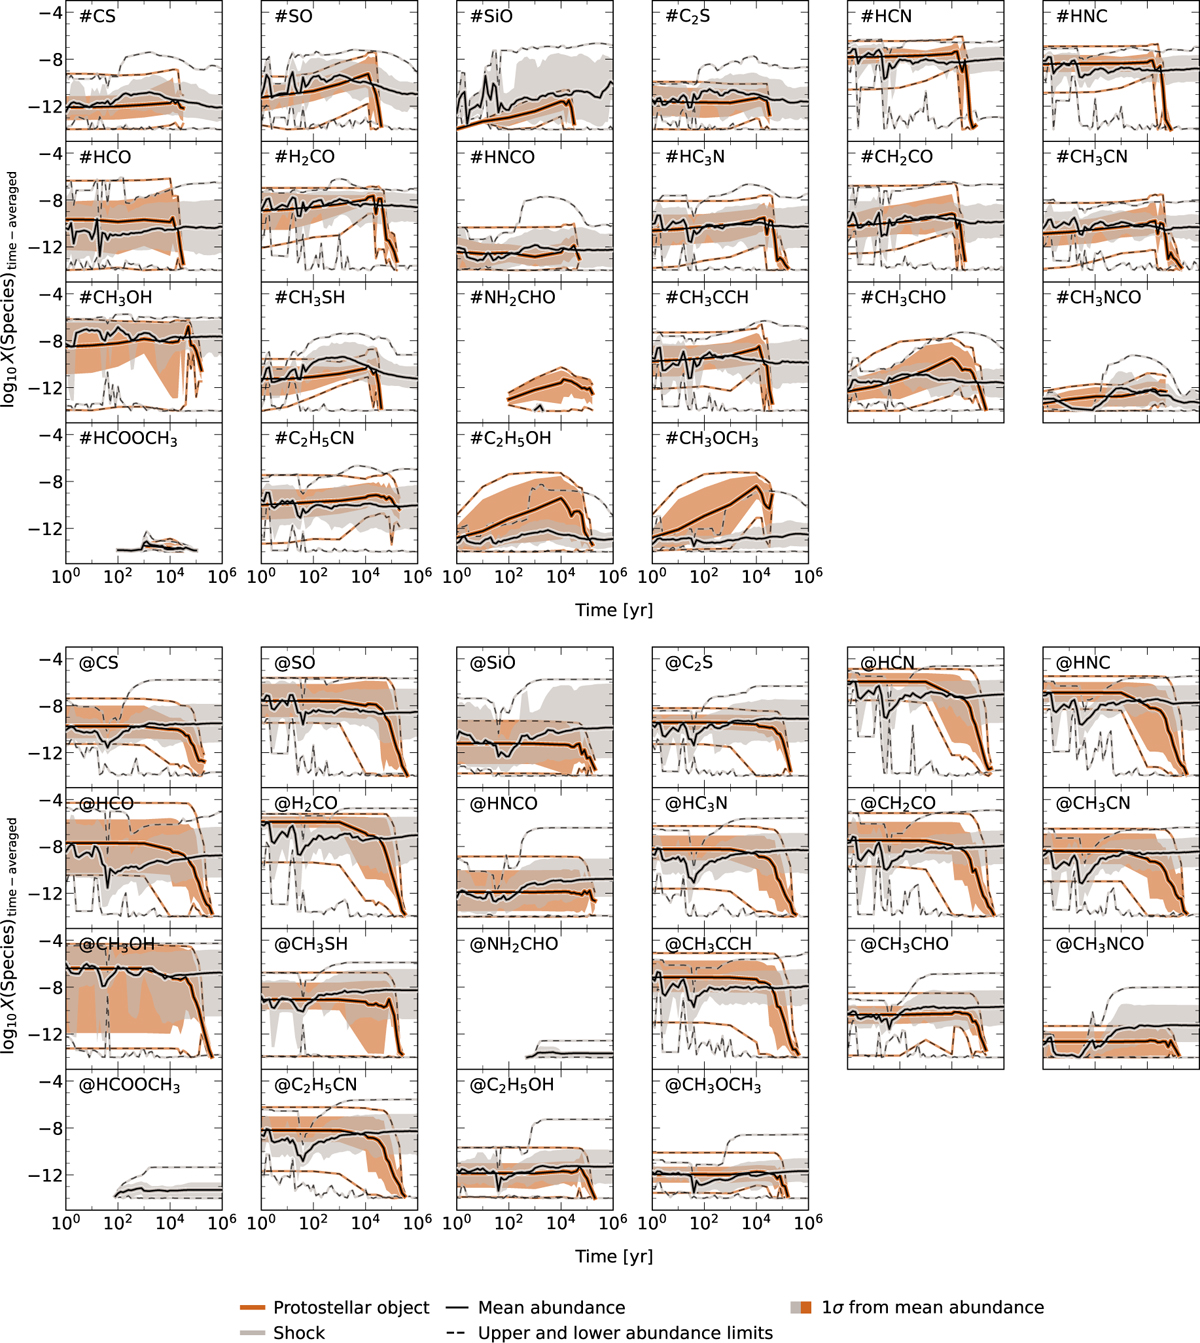
Fig. A.1
Download original image
Time-averaged chemical evolution of selected species on the surface (top) and in the bulk (bottom). Time-averaging refers to averaging abundances across all models of a given type at fixed logarithmic time intervals. The solid black line shows the mean abundances at each time step, with shaded areas representing the 1σ confidence interval. The dashed lines indicate the upper and lower temperature bounds.
Current usage metrics show cumulative count of Article Views (full-text article views including HTML views, PDF and ePub downloads, according to the available data) and Abstracts Views on Vision4Press platform.
Data correspond to usage on the plateform after 2015. The current usage metrics is available 48-96 hours after online publication and is updated daily on week days.
Initial download of the metrics may take a while.