Fig. 2
Download original image
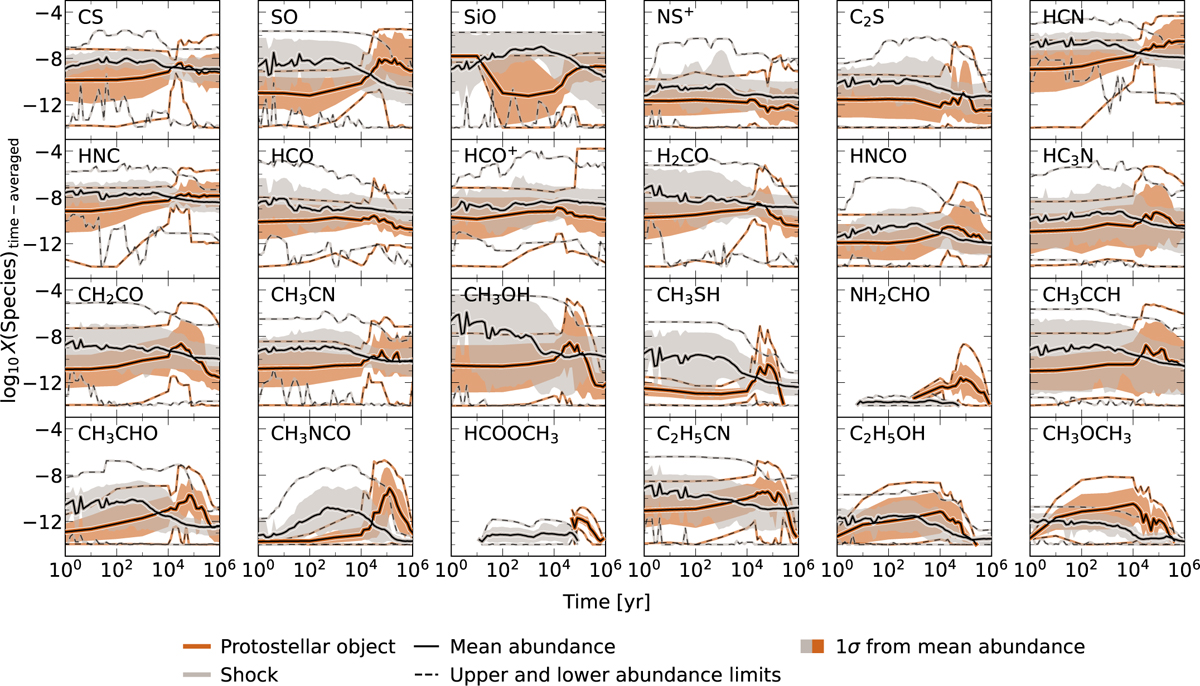
Time-averaged chemical evolution of the studied species across all second stage models, as defined in Table 2. Line styles and shading follow those in Fig. 1. Only gas-phase abundances above the detectable threshold (X > 10−14) are considered. Changes in abundance, including both enhancement and depletion, generally follow the timescales seen in the average temperature profiles (see Fig. 1). In models of protostellar objects, the species that most frequently dominates over the others is HCN, whereas in shocks CH3OH is the most dominant during the shock phase, while SiO takes over in the post-shock phase.
Current usage metrics show cumulative count of Article Views (full-text article views including HTML views, PDF and ePub downloads, according to the available data) and Abstracts Views on Vision4Press platform.
Data correspond to usage on the plateform after 2015. The current usage metrics is available 48-96 hours after online publication and is updated daily on week days.
Initial download of the metrics may take a while.