Fig. 3
Download original image
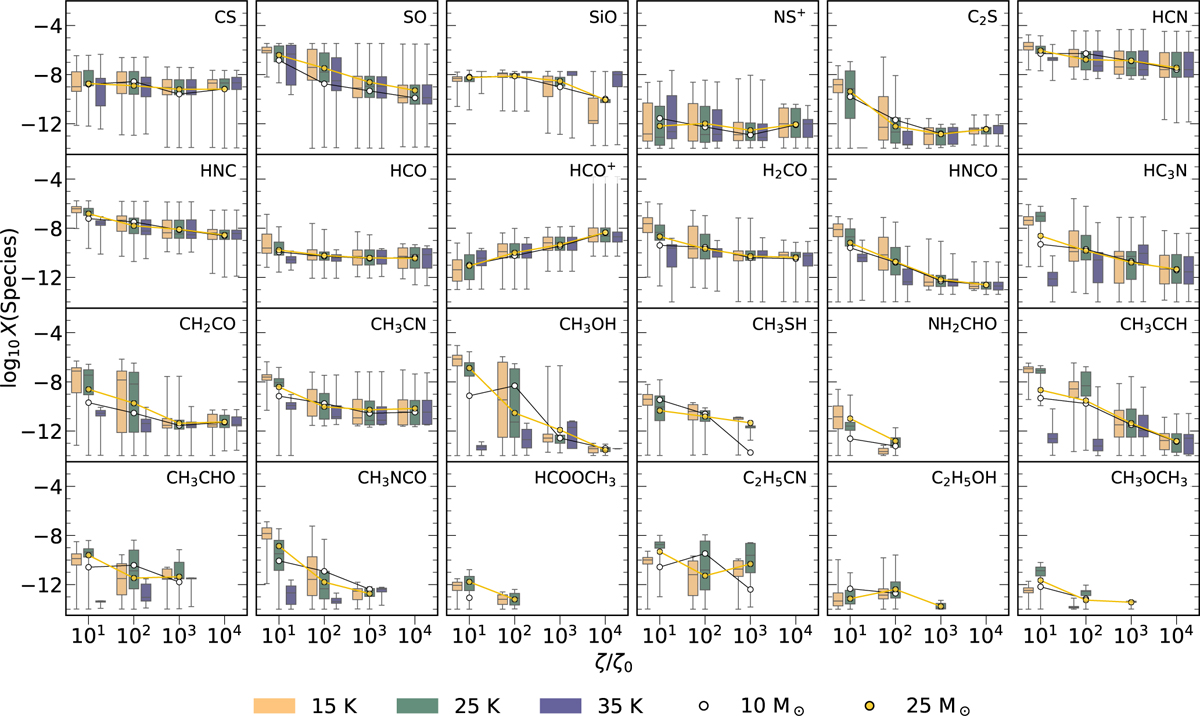
Box plots of the fractional abundances of each species in the protostellar objects (fully warmed-up phase), as a function of the cosmicray ionization rate (x-axis) and initial temperature of gas and dust (indicated by different colors). The interquartile ranges (IQRs) represent the middle 50% of the abundance distribution, while the whiskers extend to the minimum and maximum values, covering the full range of the data. Additionally, the evolution of mean abundances for different object masses is overplotted, with circles denoting the mean values for each mass. If no distribution is observed at a given ζ/ζ0, it suggests the species remained below the observational threshold throughout.
Current usage metrics show cumulative count of Article Views (full-text article views including HTML views, PDF and ePub downloads, according to the available data) and Abstracts Views on Vision4Press platform.
Data correspond to usage on the plateform after 2015. The current usage metrics is available 48-96 hours after online publication and is updated daily on week days.
Initial download of the metrics may take a while.