Fig. 7
Download original image
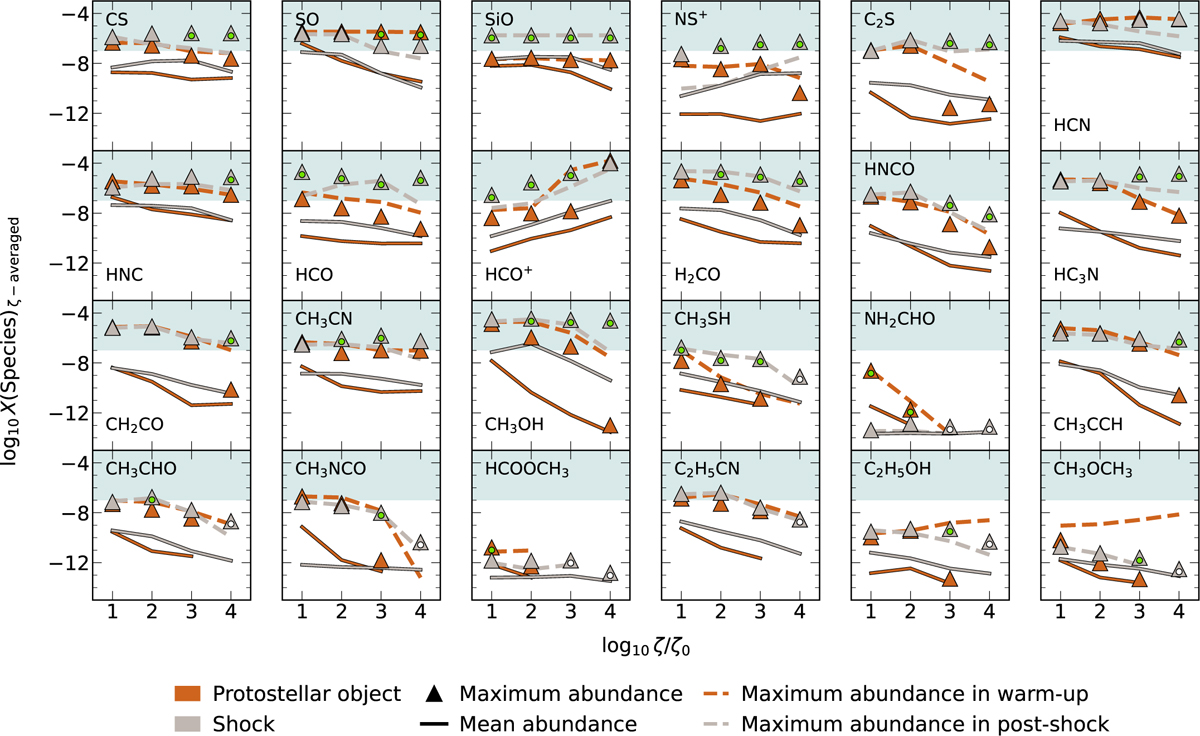
Maximum and mean abundances of species at different evolutionary stages across models with varying cosmic-ray ionization rates. The orange and gray triangles show maximum abundances in fully warmed-up protostellar objects and shocks, respectively, while lines of corresponding colors represent mean abundances. The dashed lines indicate maximum abundances during the warm-up stage of protostellar objects (orange) and the post-shock stage (gray). The green circles mark species where the maximum abundance differs by at least one order of magnitude between shock and fully warmed-up protostellar objects, indicating potential effectiveness as tracers of cosmic-ray ionization rate in the respective environments. The white circles identify cases where one model type produces detectable abundances, while the other falls below detection limits. Gray shading highlights the abundance region where species are considered highly abundant (X(Species) > 10−7) under a given ionization rate. For a detailed explanation of each evolutionary stage, we refer to Sect. 3.
Current usage metrics show cumulative count of Article Views (full-text article views including HTML views, PDF and ePub downloads, according to the available data) and Abstracts Views on Vision4Press platform.
Data correspond to usage on the plateform after 2015. The current usage metrics is available 48-96 hours after online publication and is updated daily on week days.
Initial download of the metrics may take a while.