Fig. 15
Download original image
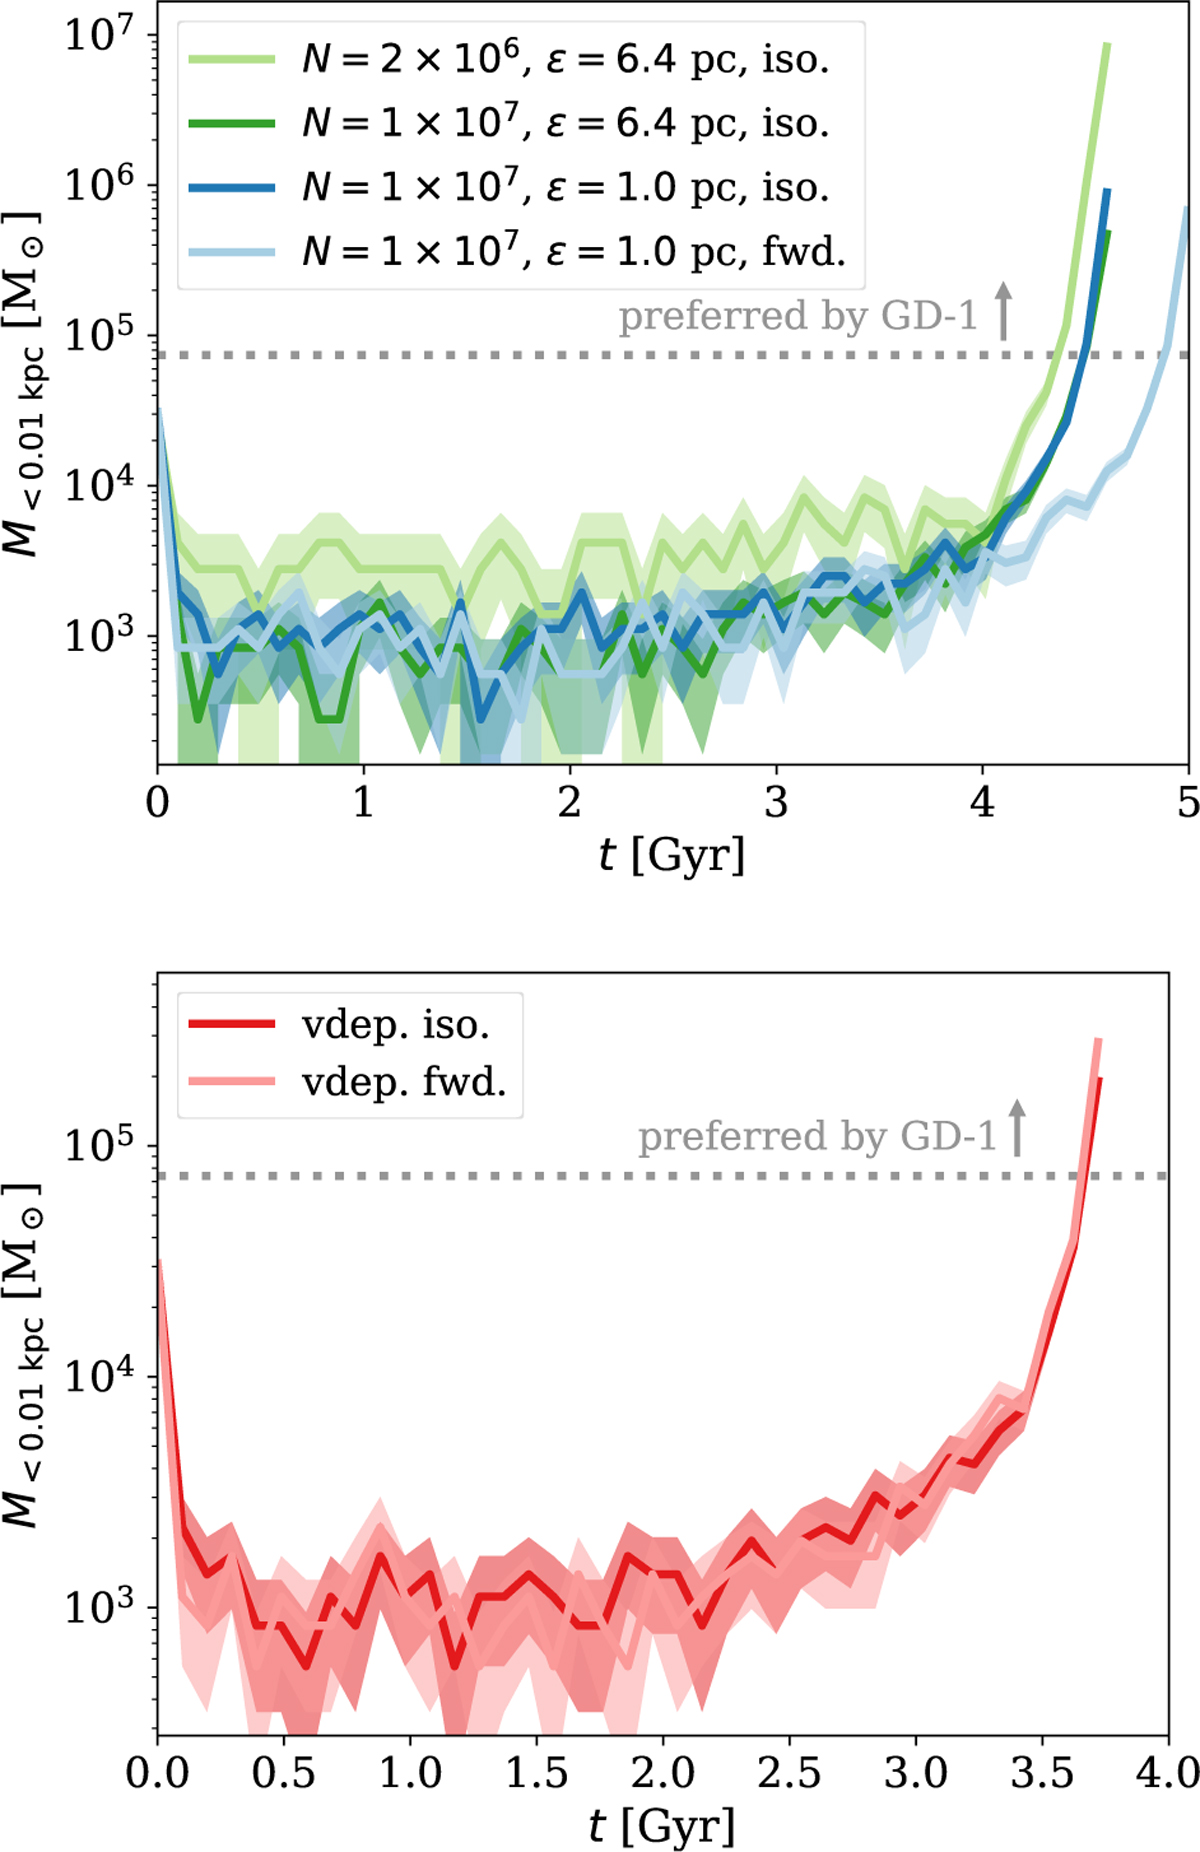
Mass enclosed within 10 pc as a function of time for the satellite halos. The upper panel gives the results for a velocity-independent cross-section (simulations U, V, W, and X), and the lower panel is for velocity-dependent cross-sections (simulations Y and Z). More details on the simulations can be found in Table A.1. In addition, the grey dotted line indicates the preferred mass range for the perturber of the stellar stream GD-1 (Bonaca et al. 2019).
Current usage metrics show cumulative count of Article Views (full-text article views including HTML views, PDF and ePub downloads, according to the available data) and Abstracts Views on Vision4Press platform.
Data correspond to usage on the plateform after 2015. The current usage metrics is available 48-96 hours after online publication and is updated daily on week days.
Initial download of the metrics may take a while.