Fig. C.1
Download original image
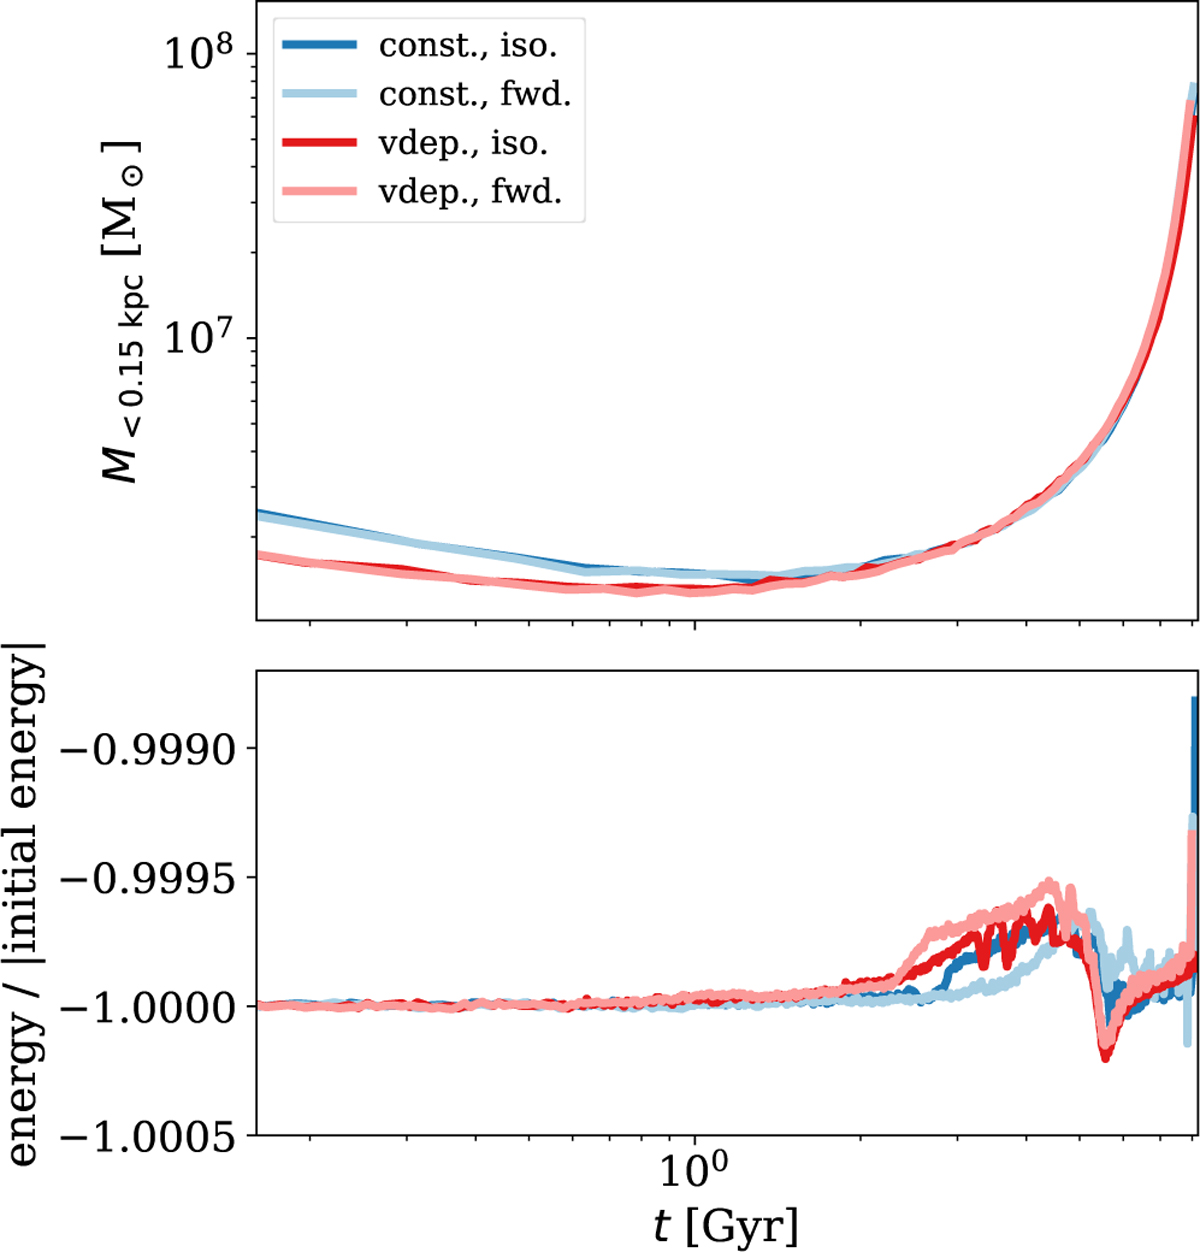
Enclosed mass and energy conservation as a function of time. We show the same simulations as in Fig. 12 (O, P, R, and S in Table A.1). The upper panel gives the mass within a radius of 0.15 kpc and the lower panels shows how well the total energy is conserved. The time for the simulations with a velocity-independent cross-section is rescaled to match the collapse phase of the simulations with velocity-dependent interactions.
Current usage metrics show cumulative count of Article Views (full-text article views including HTML views, PDF and ePub downloads, according to the available data) and Abstracts Views on Vision4Press platform.
Data correspond to usage on the plateform after 2015. The current usage metrics is available 48-96 hours after online publication and is updated daily on week days.
Initial download of the metrics may take a while.