Fig. 2
Download original image
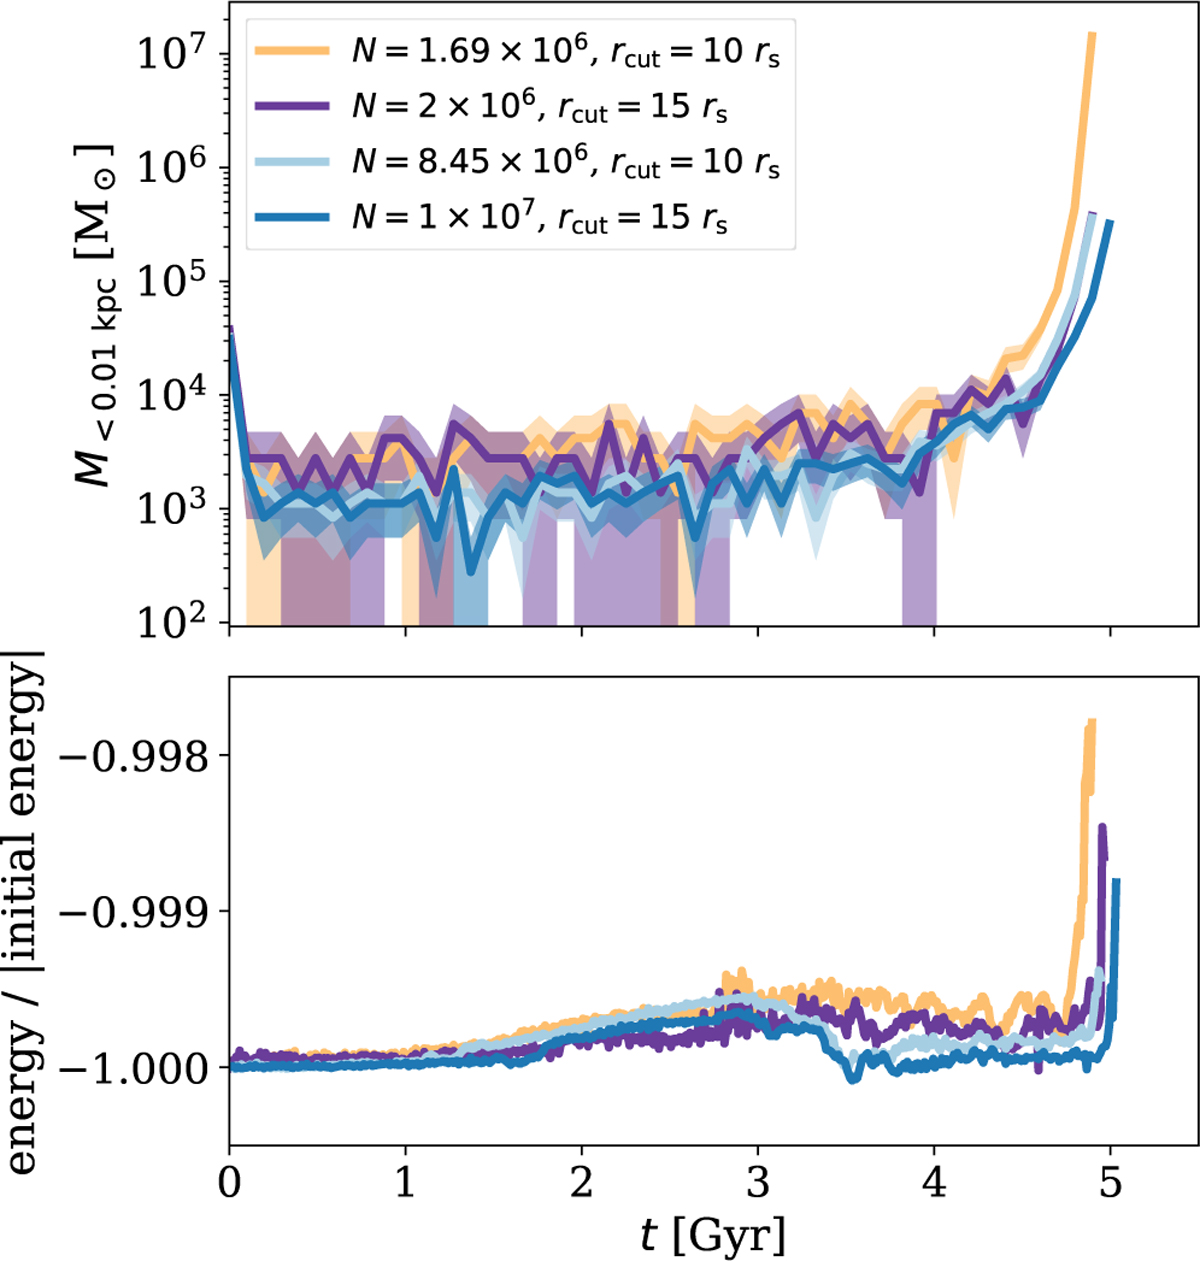
Variation of the maximum sampling radius for the ICs. Analogously to Fig. 1, the mass enclosed within 10 pc (upper panel) and the energy conservation (lower panel) are shown as a function of time. The results for ICs sampled up to 10 rs (orange and light blue) and 15 rs (purple and dark blue) are shown. We note that the lower resolution simulations (orange and purple) employ a softening length of ϵ = 6.4 pc, whereas the higher resolution simulations (light and dark blue) employ a softening length of ϵ = 1.0 pc. All parameters for the shown simulations (G, J, M, and O) are given in Table A.1.
Current usage metrics show cumulative count of Article Views (full-text article views including HTML views, PDF and ePub downloads, according to the available data) and Abstracts Views on Vision4Press platform.
Data correspond to usage on the plateform after 2015. The current usage metrics is available 48-96 hours after online publication and is updated daily on week days.
Initial download of the metrics may take a while.