Fig. 7
Download original image
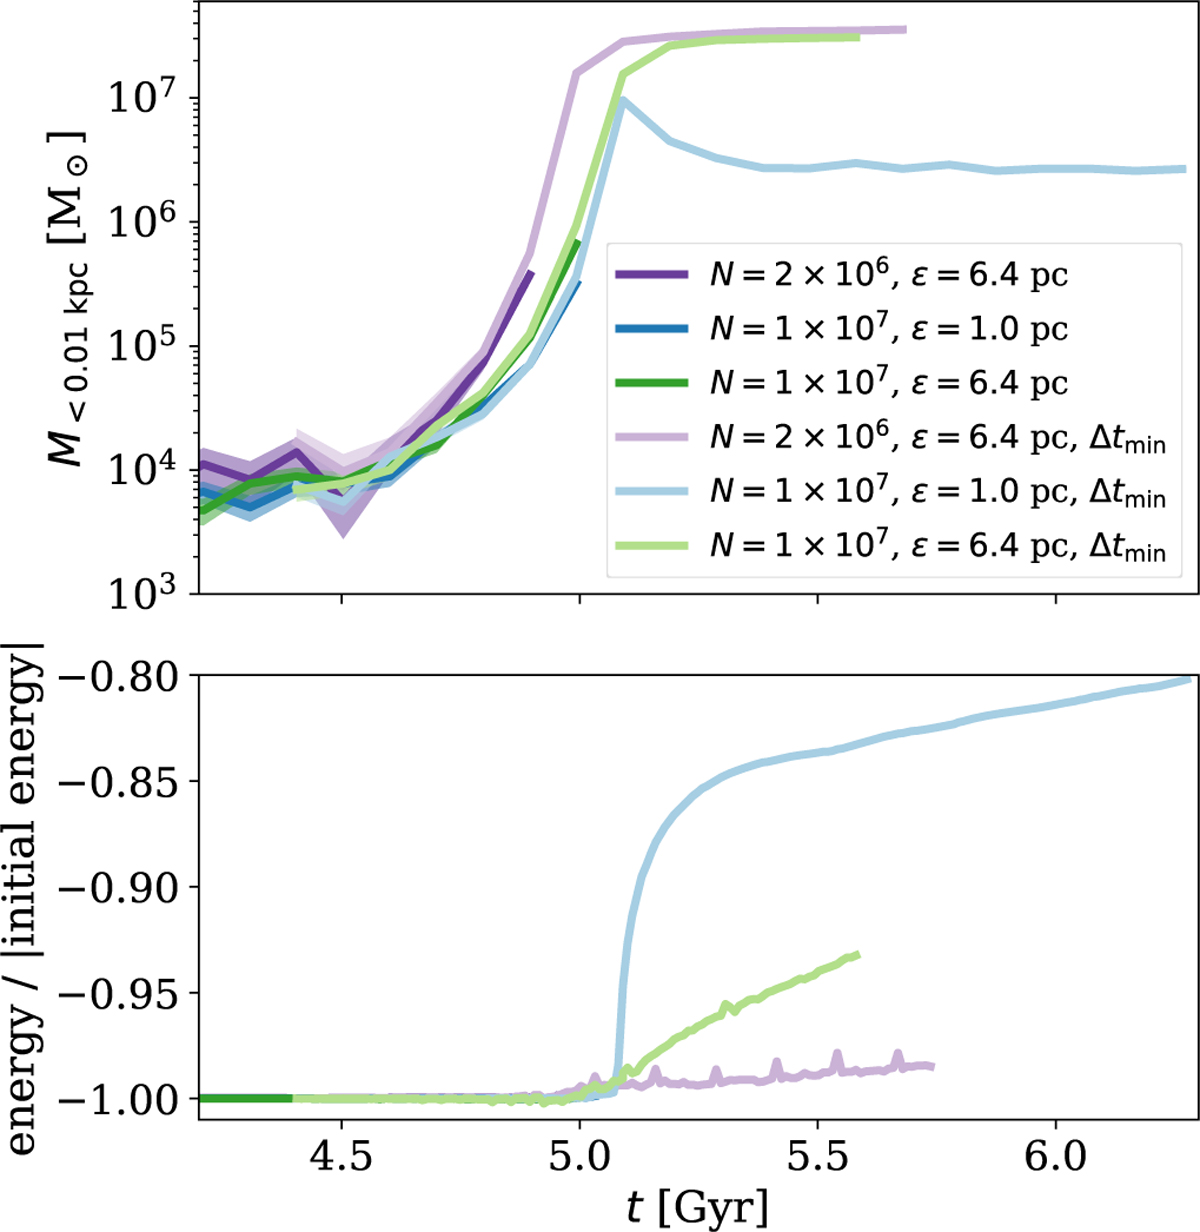
Employing a minimum time step. As in Fig. 1, we show the enclosed mass within 10 pc and the energy conservation for various simulations. This time, we investigate how much the simulations are affected when employing a minimum time step. The brighter lines indicate simulations without a minimum time step, i.e. the time step can decrease further. In contrast the darker lines feature a minimum time step of Δtmin = 2.8 × 10⁻⁵ Gyr. The displayed simulations J, N, O, Jt, Nt, and Ot are described in Table A.1.
Current usage metrics show cumulative count of Article Views (full-text article views including HTML views, PDF and ePub downloads, according to the available data) and Abstracts Views on Vision4Press platform.
Data correspond to usage on the plateform after 2015. The current usage metrics is available 48-96 hours after online publication and is updated daily on week days.
Initial download of the metrics may take a while.