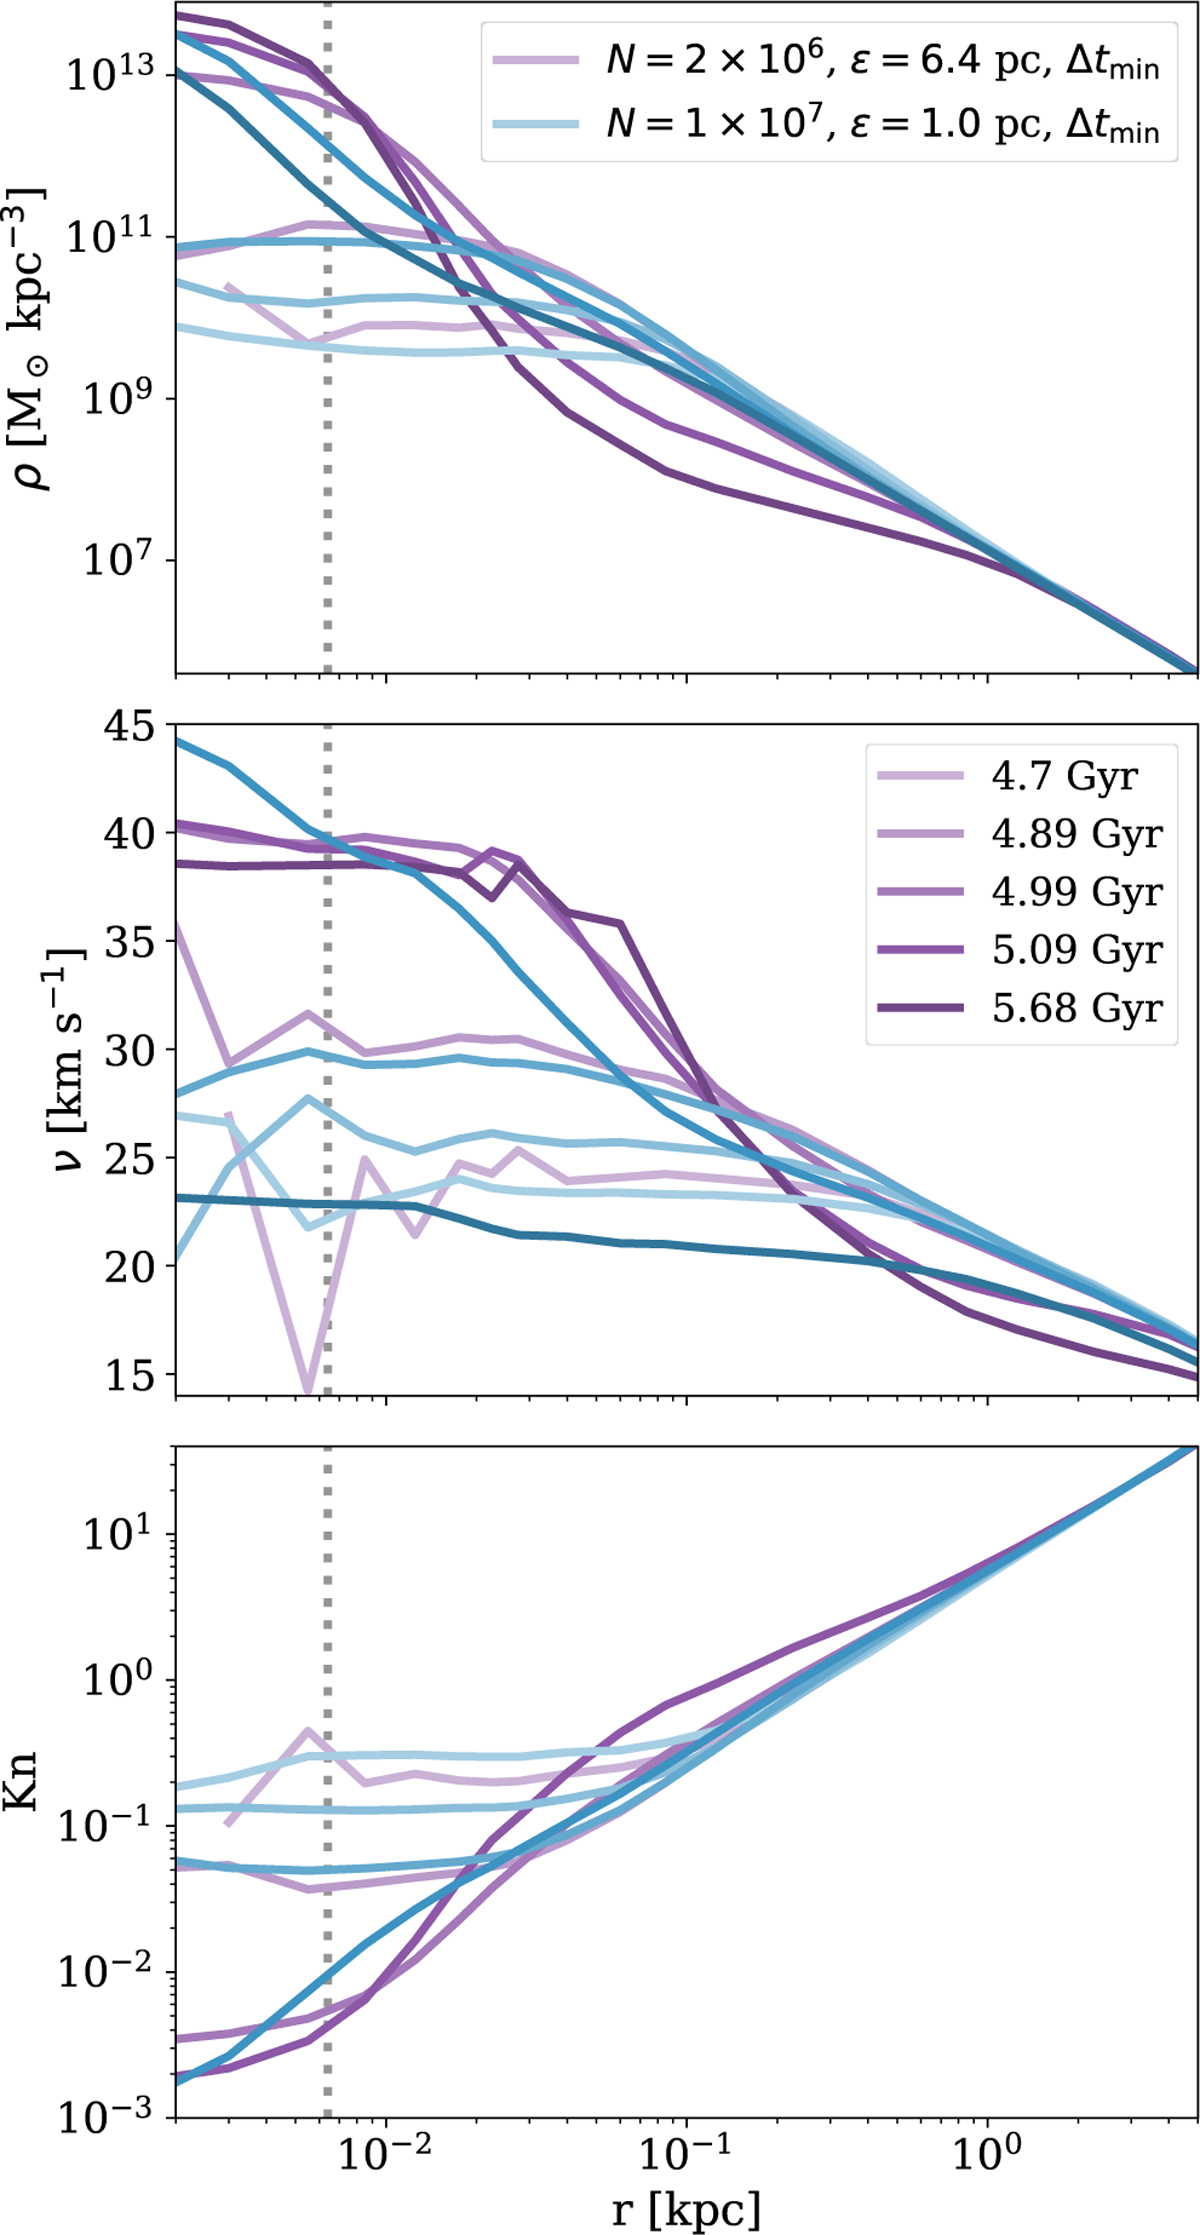
Fig. 8
Download original image
Density, velocity dispersion, and Knudsen number for simulations employing a minimum time step. The purple lines give the results for the simulation with N = 2 × 10⁶ and ϵ = 6.4 pc (grey) and Δtmin = 2.8 × 10⁻⁵ Gyr and the blue lines are for the simulation with N = 1 × 10⁷ and ϵ = 1.0 pc and Δtmin = 2.8 × 10⁻⁵ Gyr. These are the same simulations as in Fig. 7. The top panel gives the density as a function of radius for different times. We note that these times are during the collapse phase, and for most of them the energy conservation error is sizeable. The middle panel gives the velocity dispersion as a function of radius, and the bottom panel displays the Knudsen number (Eq. (3)). All parameters for the shown simulations Jt and Ot are given in Table A.1.
Current usage metrics show cumulative count of Article Views (full-text article views including HTML views, PDF and ePub downloads, according to the available data) and Abstracts Views on Vision4Press platform.
Data correspond to usage on the plateform after 2015. The current usage metrics is available 48-96 hours after online publication and is updated daily on week days.
Initial download of the metrics may take a while.