Open Access
Fig. 4
Download original image
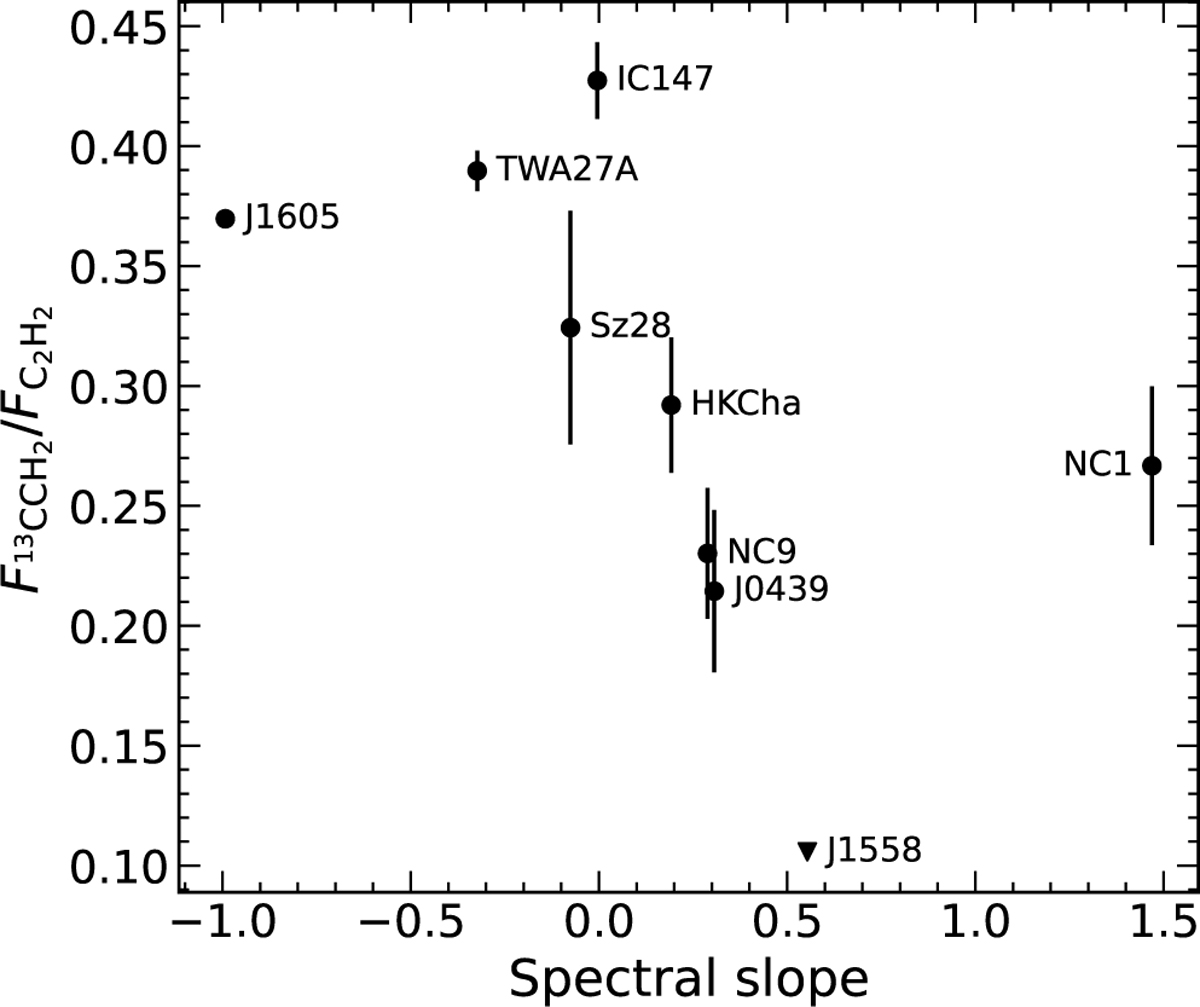
Gas column density and spectral slope. ![]() represents gas column density, measured in Paper I. J1558 is the upper limit value for
represents gas column density, measured in Paper I. J1558 is the upper limit value for ![]() .
.
Current usage metrics show cumulative count of Article Views (full-text article views including HTML views, PDF and ePub downloads, according to the available data) and Abstracts Views on Vision4Press platform.
Data correspond to usage on the plateform after 2015. The current usage metrics is available 48-96 hours after online publication and is updated daily on week days.
Initial download of the metrics may take a while.