Fig. 5
Download original image
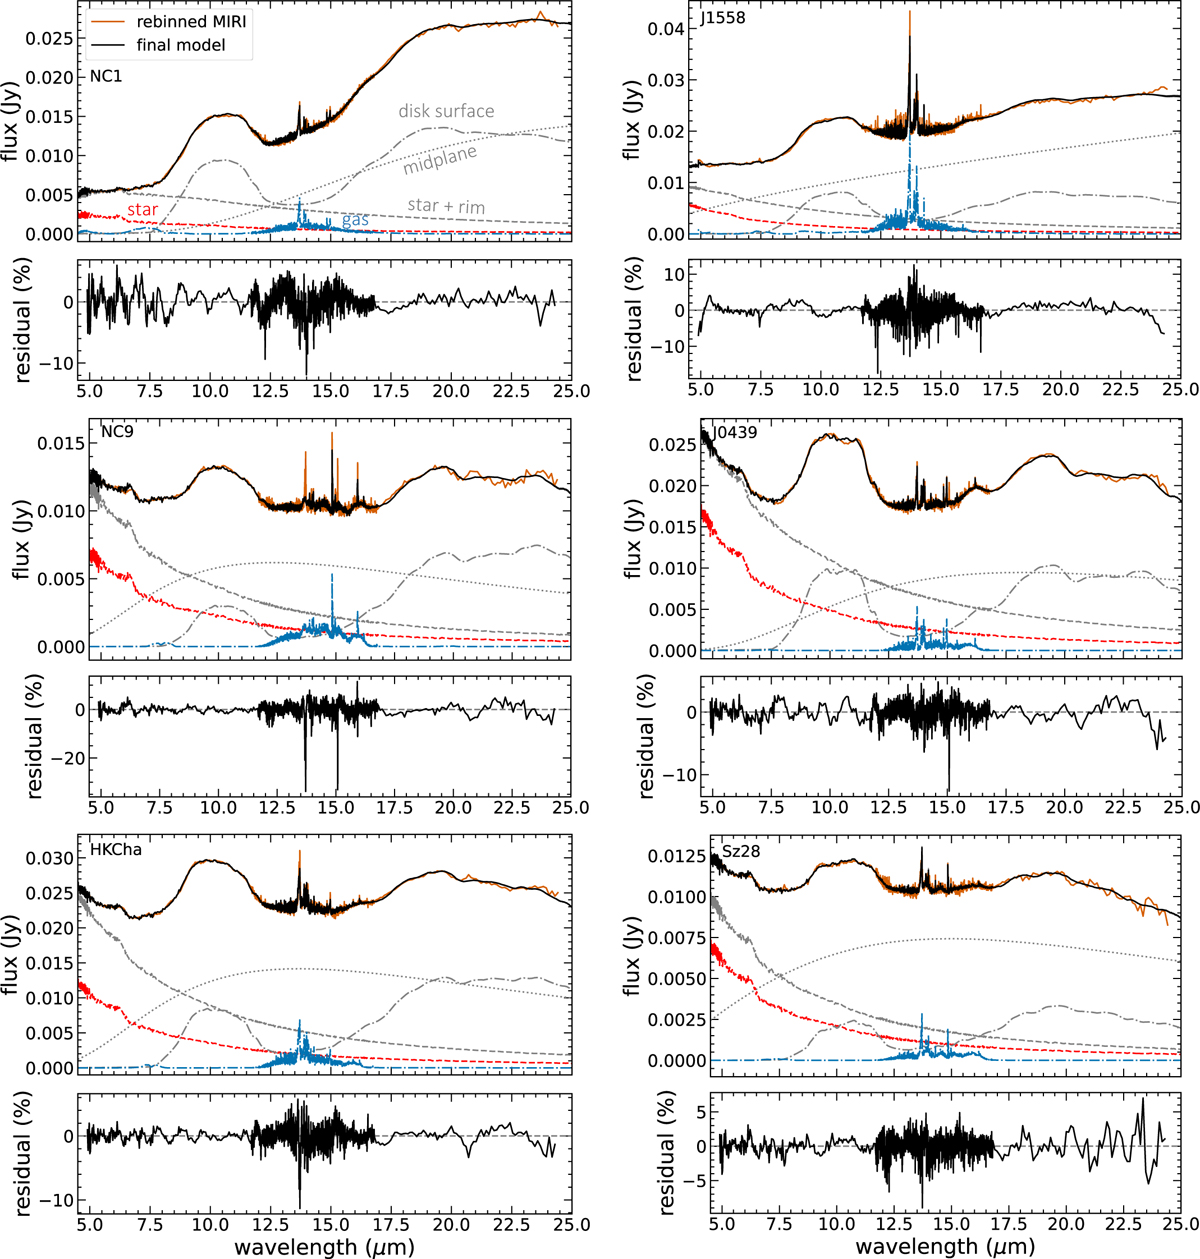
DuCKLinG fitting results for NC1, J1558, NC9, J0439, HKCha, and Sz28. The final model corresponds to the solid black line, and the rebinned MIRI spectrum corresponds to the orange line. The dashed, dotted, and dash-dotted gray lines denote the inner rim and the stellar (red line) combined component, the midplane component, and the disk surface component, respectively. The blue line is the gas emission component.
Current usage metrics show cumulative count of Article Views (full-text article views including HTML views, PDF and ePub downloads, according to the available data) and Abstracts Views on Vision4Press platform.
Data correspond to usage on the plateform after 2015. The current usage metrics is available 48-96 hours after online publication and is updated daily on week days.
Initial download of the metrics may take a while.