Fig. 1.
Download original image
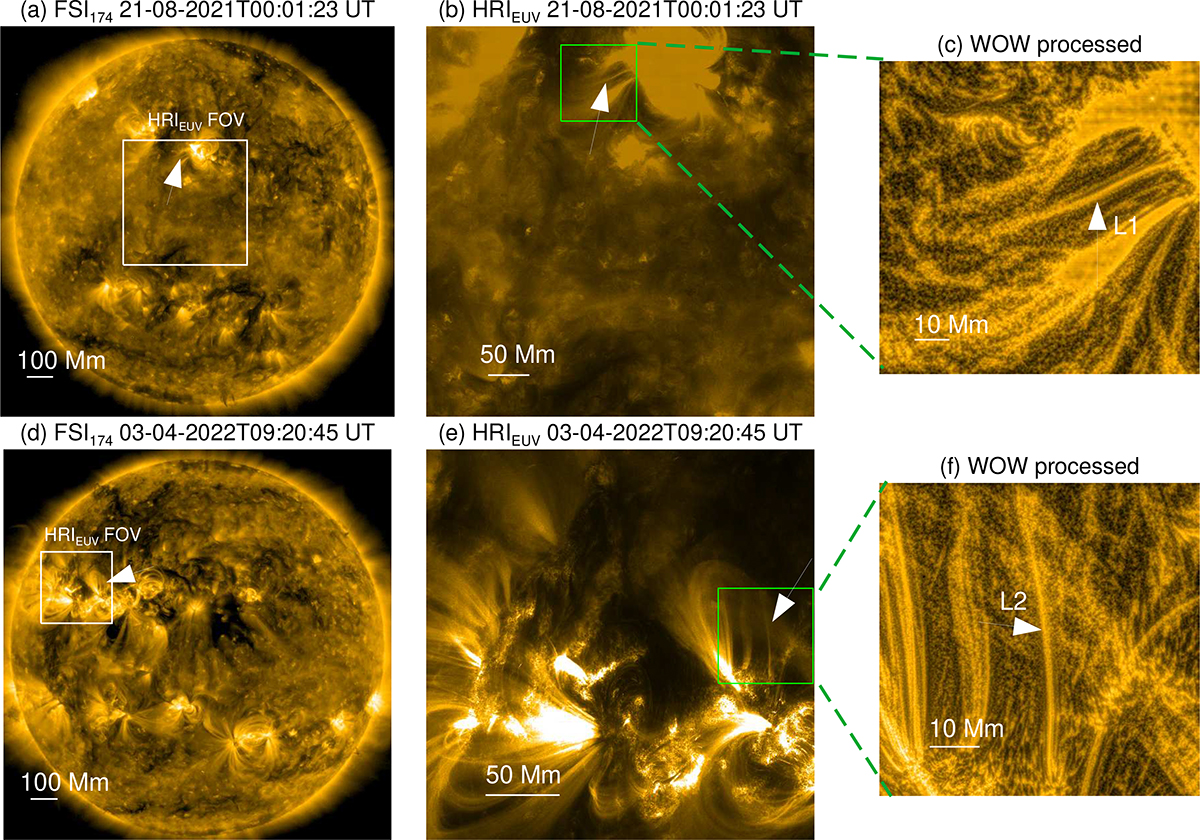
Overview of loops L1 and L2. (a) Full-disk image of FSI174, highlighting the location of L1 (indicated by a white arrow) in NOAA AR 12859. The region enclosed by the white square marks the field of view of HRIEUV. (b) Snapshot of HRIEUV, with a larger zoomed-in view of L1. The region enclosed by the green square is WOW-processed and shown in (c). (d)–(f) Same as (a)–(c), but for L2.
Current usage metrics show cumulative count of Article Views (full-text article views including HTML views, PDF and ePub downloads, according to the available data) and Abstracts Views on Vision4Press platform.
Data correspond to usage on the plateform after 2015. The current usage metrics is available 48-96 hours after online publication and is updated daily on week days.
Initial download of the metrics may take a while.