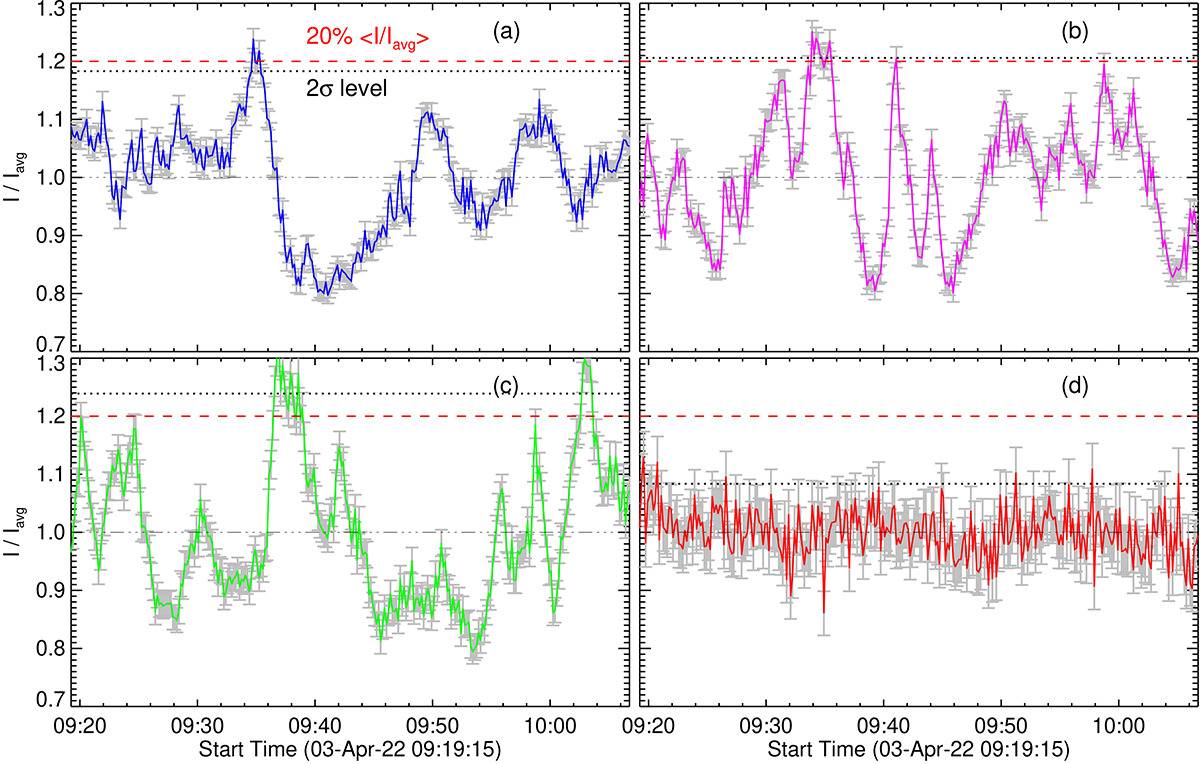
Fig. E.1.
Download original image
Normalized light curves for the four regions marked in Fig. D.1(c). (a) & (b) Normalized intensity variations at two different locations within the EUV L2 footpoint. (c) Same as (a), but for a region in the moss. (d) Same as (c), but for a region farther from the moss. The threshold of 20% ⟨I/Iavg⟩ and 2σ levels are indicated by dashed (in red) and dotted horizontal lines, respectively, in all panels.
Current usage metrics show cumulative count of Article Views (full-text article views including HTML views, PDF and ePub downloads, according to the available data) and Abstracts Views on Vision4Press platform.
Data correspond to usage on the plateform after 2015. The current usage metrics is available 48-96 hours after online publication and is updated daily on week days.
Initial download of the metrics may take a while.