Fig. 2.
Download original image
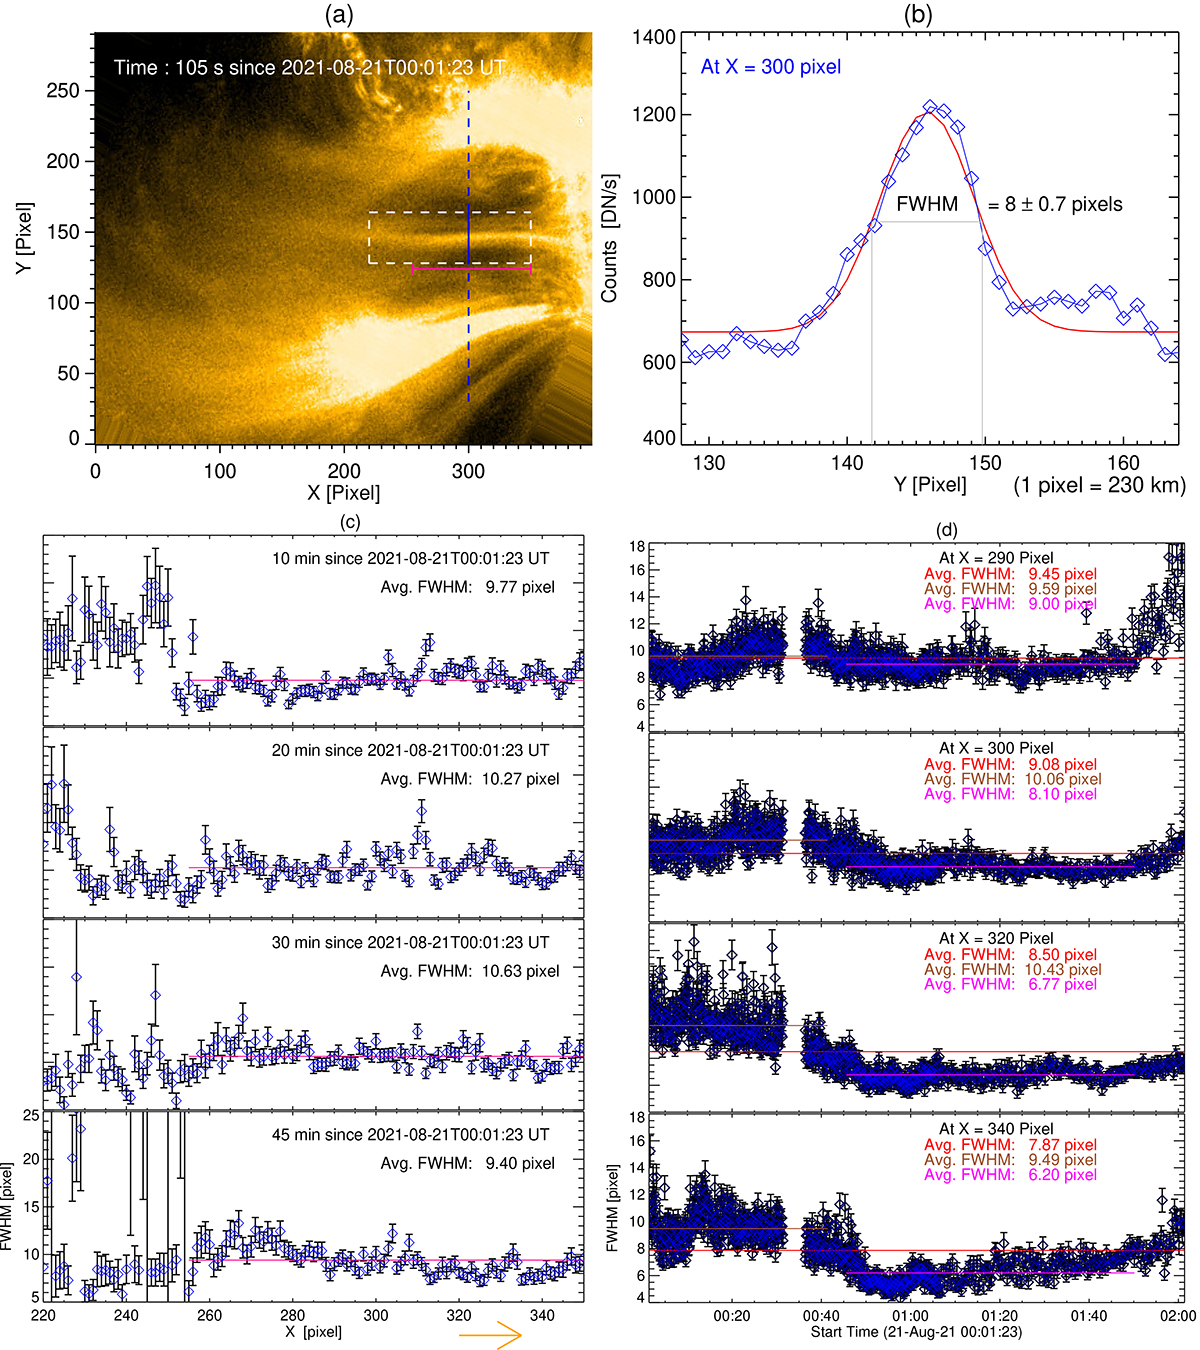
(a) Sample-rotated HRIEUV snapshot with L1 aligned parallel to X-axis. The vertical dashed blue line marks the position at X = 300-pixel. (b) The cross-sectional intensity profile along the vertical solid blue line in (a) is plotted as a blue curve, with a Gaussian fit overlaid in red. The FWHM of the fit is considered as the width of L1. (c) Spatial variations of cross-sectional widths of the L1 loop, from positions X = 220 to X = 355-pixel, are plotted at ten-minute intervals for the first 45 minutes of L1 observations. The average width is computed for the better part of L1, which is indicated by pink horizontal line in (a). The orange arrow at the bottom points toward the footpoint of L1. (d) Temporal variations of widths of L1 at different positions are plotted over the total two-hour period. Due to lateral disappearance of strands in L1 after 45 minutes, separate average widths for before and after this time, including the averages for whole period are noted in all panels. A short data gap occurred between 00:30 and 00:35, during which no observations were recorded.
Current usage metrics show cumulative count of Article Views (full-text article views including HTML views, PDF and ePub downloads, according to the available data) and Abstracts Views on Vision4Press platform.
Data correspond to usage on the plateform after 2015. The current usage metrics is available 48-96 hours after online publication and is updated daily on week days.
Initial download of the metrics may take a while.