Fig. B.1.
Download original image
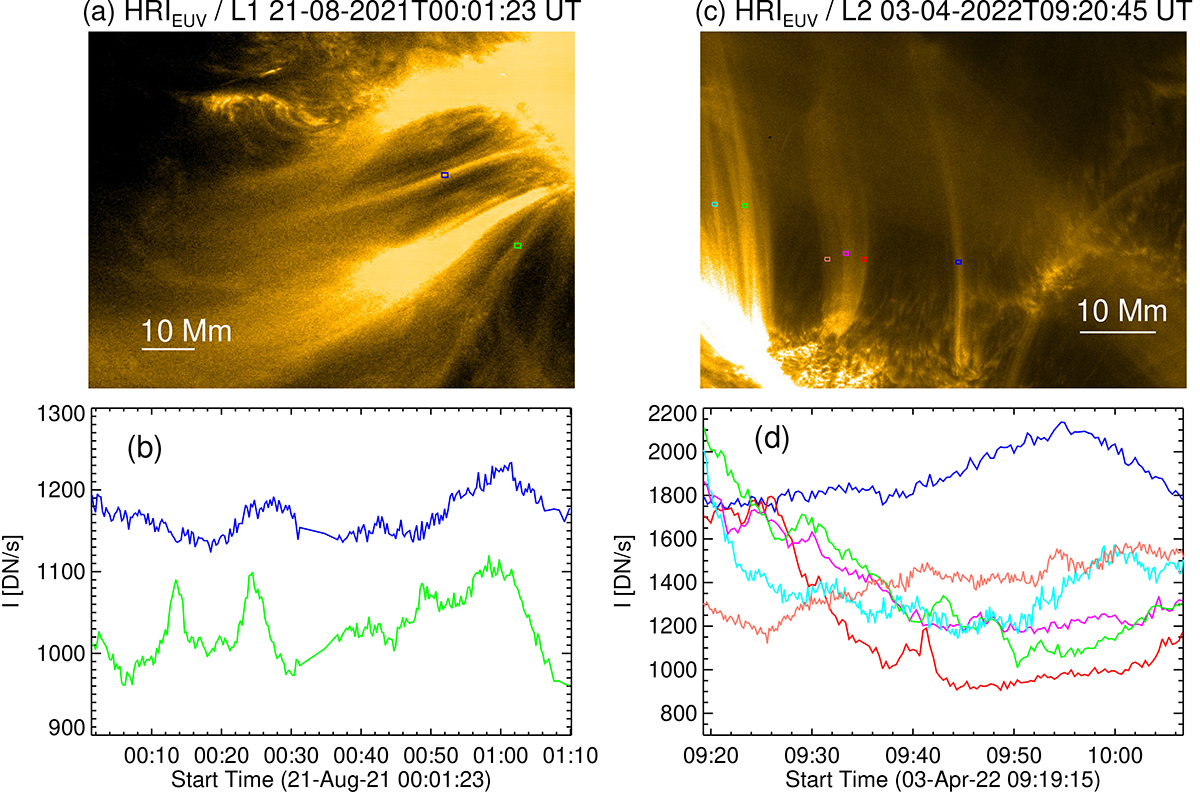
(a) A close-up view of the HRIEUV region within the green box in Fig. 1(b), enclosing loop L1. The small boxes, each of size 5×5 pixels marked in different colors, are used to compute the light curves, which are plotted in the corresponding colors in (b). (c)-(d) Same as (a)-(b), but for loop L2. Notably, both L1 and L2 (blue curves) exhibit minimal variations in intensity during their evolution unlike their neighboring counterparts.
Current usage metrics show cumulative count of Article Views (full-text article views including HTML views, PDF and ePub downloads, according to the available data) and Abstracts Views on Vision4Press platform.
Data correspond to usage on the plateform after 2015. The current usage metrics is available 48-96 hours after online publication and is updated daily on week days.
Initial download of the metrics may take a while.