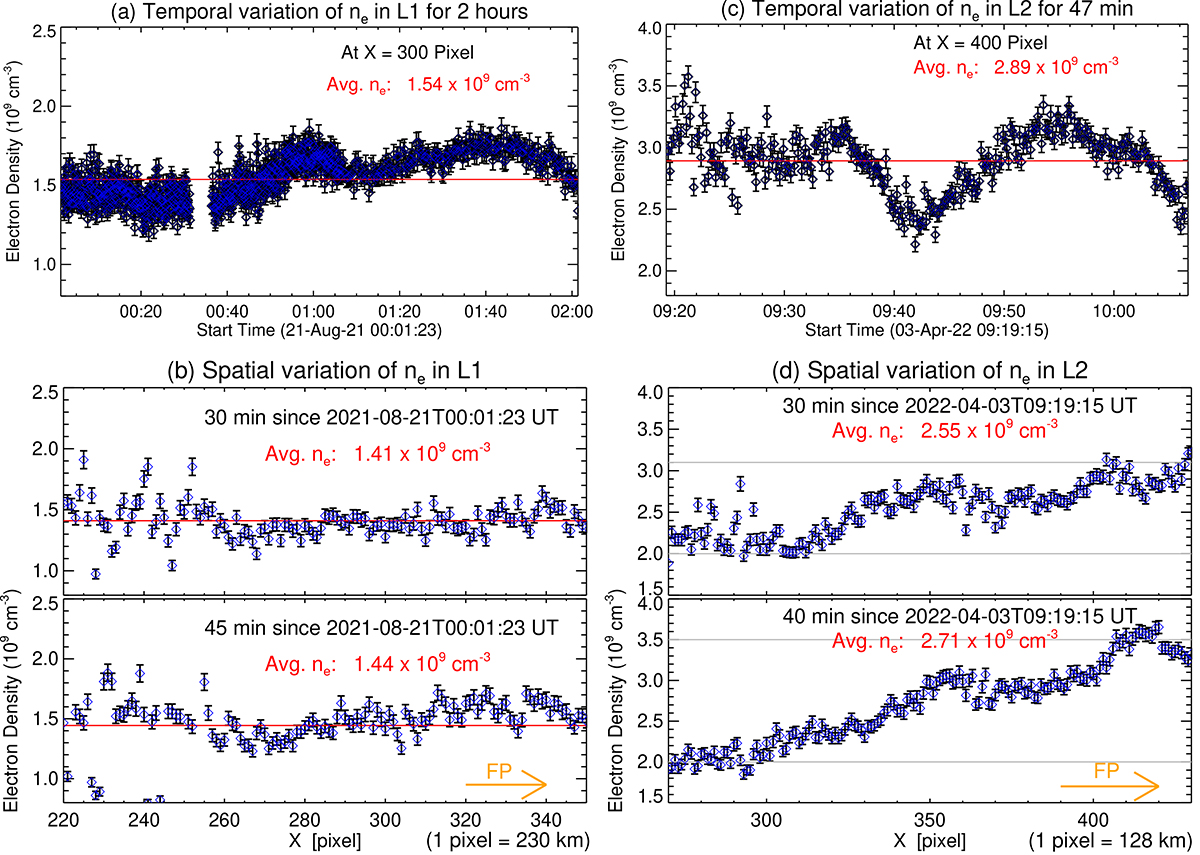
Fig. C.1.
Download original image
(a) The variations of ne in loop L1 at position X = 300 pixel for over the time period of 2 hours. Horizontal line in red marks the mean ne over this time period. (b) Same as (a) but for loop L2 for over the time period of 47 minutes. (c) Uniform variation of ne along L1 after 30 and 45 minutes from the start time of L1 observations. (d) Spatial variation of ne along L2 after 30 and 40 minutes from the start time of L2 observations. Two Grey horizontal lines are plotted to highlight the increase in ne from higher part of L2 towards its footpoint (FP). Orange arrows point to loop footpoints.
Current usage metrics show cumulative count of Article Views (full-text article views including HTML views, PDF and ePub downloads, according to the available data) and Abstracts Views on Vision4Press platform.
Data correspond to usage on the plateform after 2015. The current usage metrics is available 48-96 hours after online publication and is updated daily on week days.
Initial download of the metrics may take a while.