Open Access
Fig. D.1.
Download original image
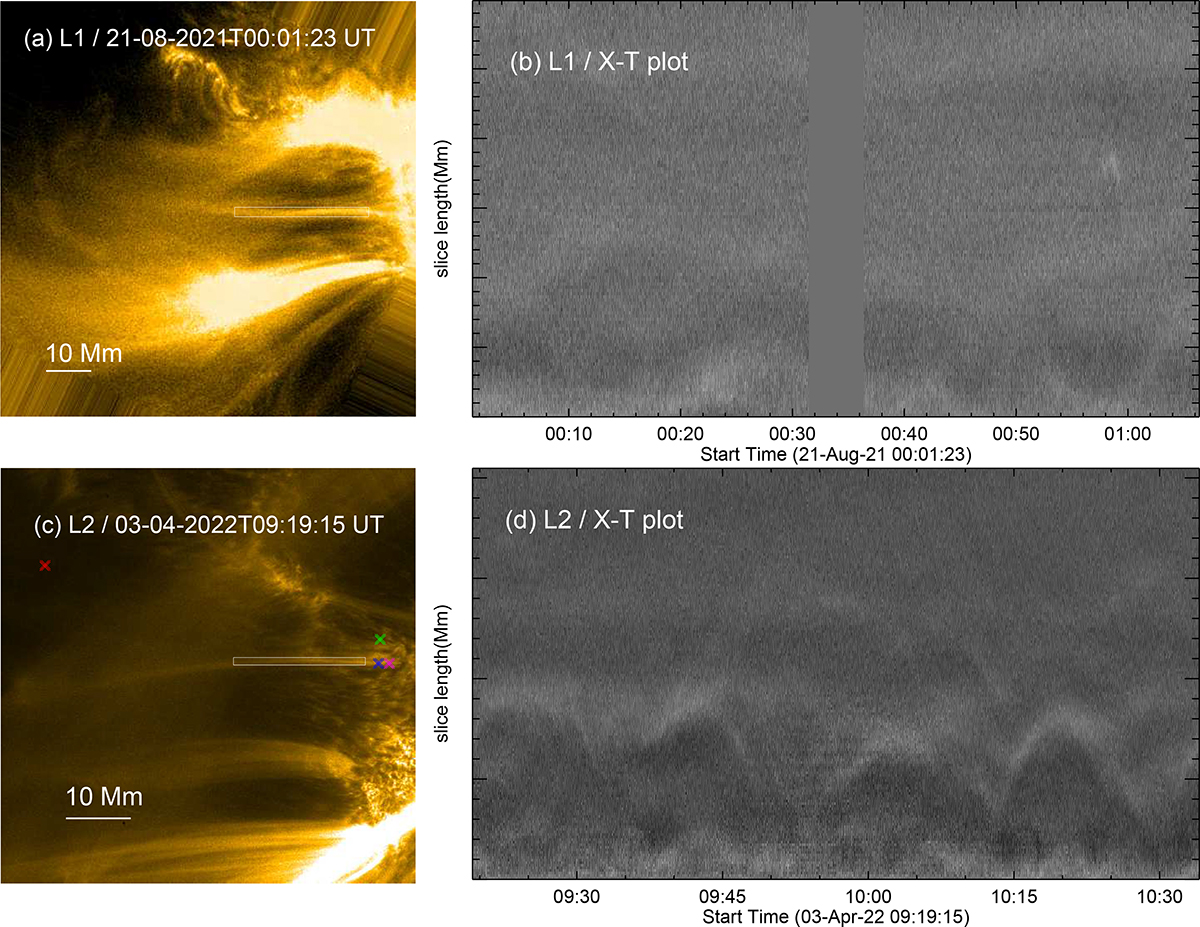
(a) Slit is placed along loop L1 and the corresponding space-time plot is displayed in (b). (c) & (d) is same as (a) & (b), but for loop L2. The cross symbols in (c) marks the location of four small sub-regions of 3 × 3 pixels, over which the normalized intensity variations are displayed in Fig. E.1.
Current usage metrics show cumulative count of Article Views (full-text article views including HTML views, PDF and ePub downloads, according to the available data) and Abstracts Views on Vision4Press platform.
Data correspond to usage on the plateform after 2015. The current usage metrics is available 48-96 hours after online publication and is updated daily on week days.
Initial download of the metrics may take a while.