Fig. C.3.
Download original image
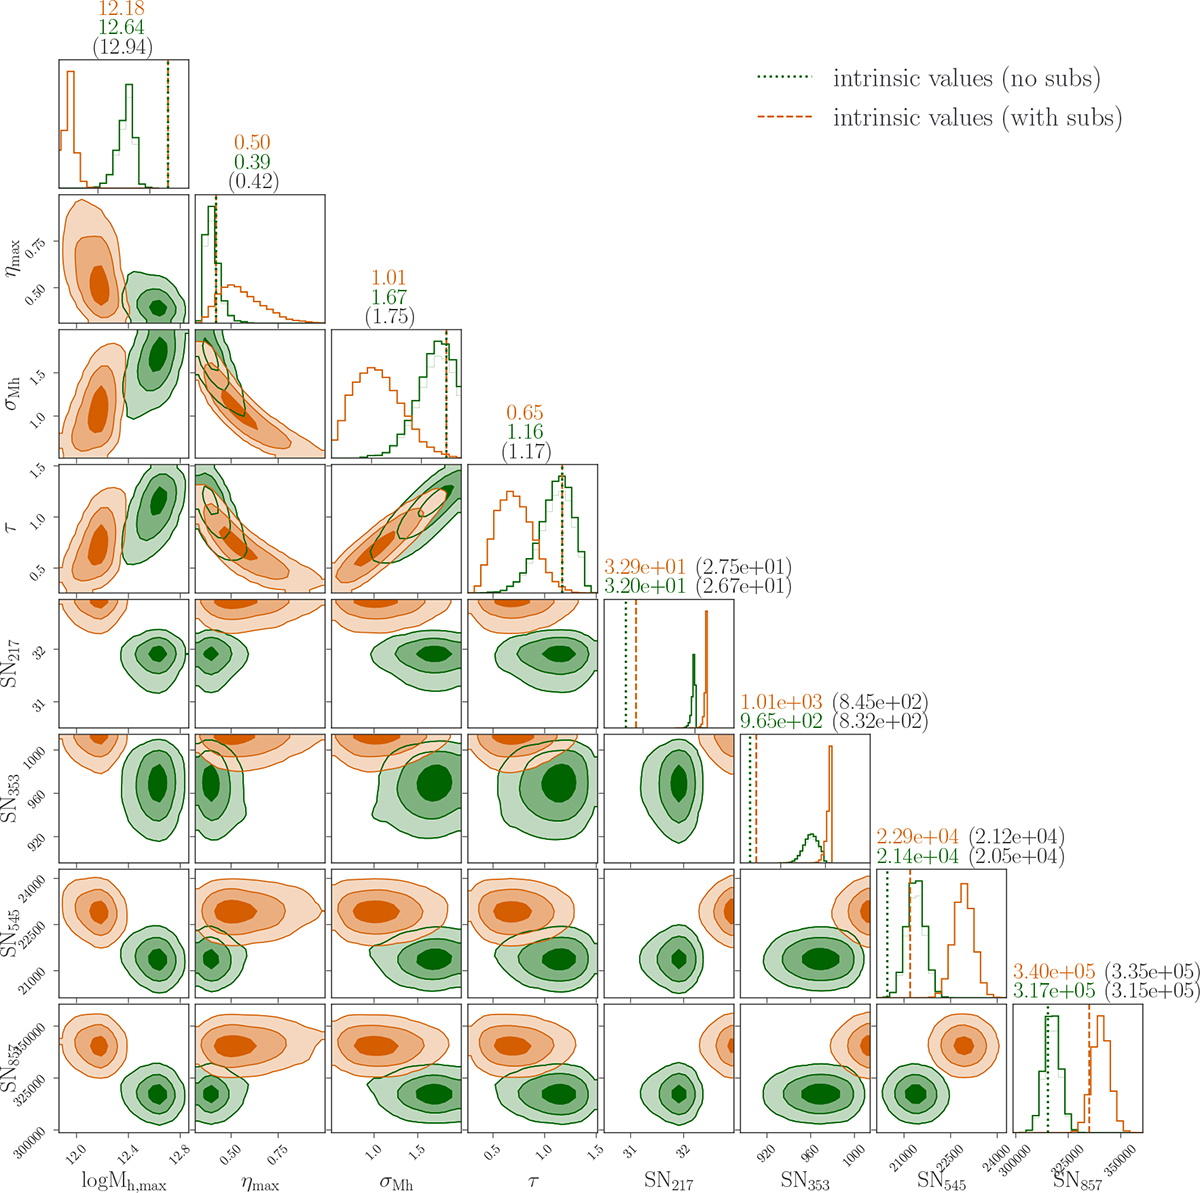
Resulting corner plots from fitting the M21 model to mock data generated with SSU (see Sect. 4.1 for a detailed description). The orange contours and histograms correspond to the scenario where the subhalos are considered ("with subs"), while the green color represents the case when subhalos are excluded ("no subs"). The intrinsic parameter values for the "with subs" and "no subs" cases are illustrated by the dotted dashed orange line and the dashed green line, respectively. Above each histogram, the best-fit value is displayed in the corresponding color, while the intrinsic value is shown in parentheses and in black. Note that the intrinsic values of the shot noise in the "no subs" and "with subs" case are not the same.
Current usage metrics show cumulative count of Article Views (full-text article views including HTML views, PDF and ePub downloads, according to the available data) and Abstracts Views on Vision4Press platform.
Data correspond to usage on the plateform after 2015. The current usage metrics is available 48-96 hours after online publication and is updated daily on week days.
Initial download of the metrics may take a while.