Fig. 3.
Download original image
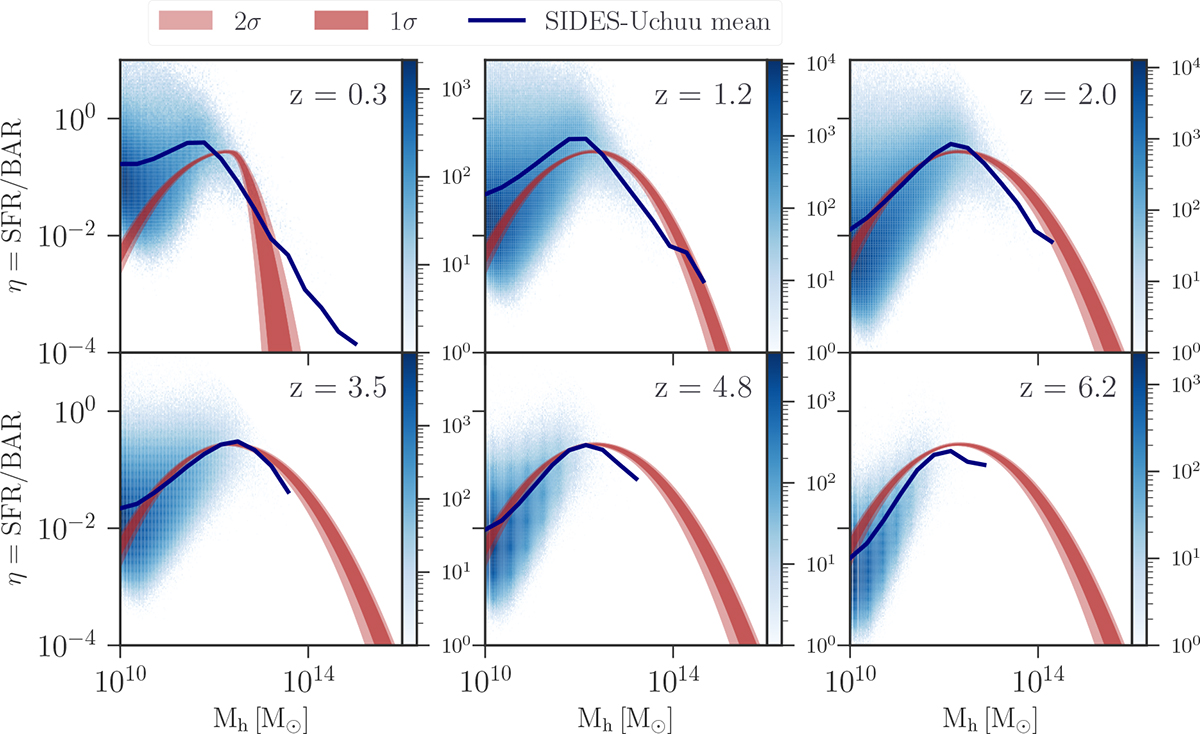
SFR-BAR efficiency from SIDES-Uchuu (blue gradient) and the mean efficiency (solid blue line). The various models from the MCMC parameter exploration of the M21 HOD model is shown in red (red contours for 1σ and 2σ). Each subplot corresponds to a different redshift, with the center of the redshift bin displayed on the top right of each panel. The redshift interval used to compute the density of the SFR/BAR values of the sources in the simulation is Δz = 0.05. The colorbar indicates the SFR/BAR value density, with blue representing high density and white indicating lower density, implying fewer sources with these values.
Current usage metrics show cumulative count of Article Views (full-text article views including HTML views, PDF and ePub downloads, according to the available data) and Abstracts Views on Vision4Press platform.
Data correspond to usage on the plateform after 2015. The current usage metrics is available 48-96 hours after online publication and is updated daily on week days.
Initial download of the metrics may take a while.