Fig. 8.
Download original image
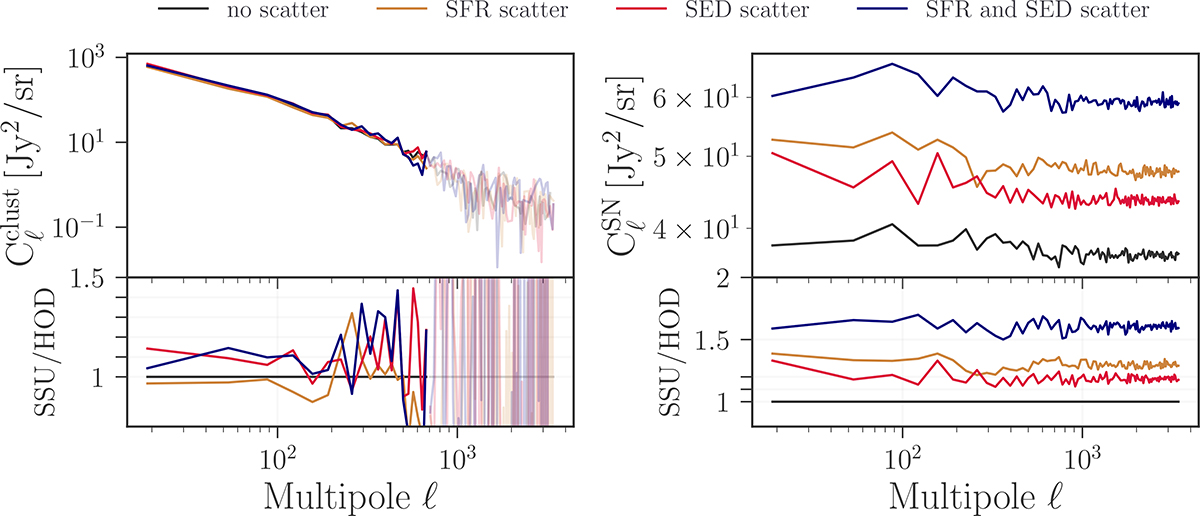
Power spectra computed using the simplified SIDES-Uchuu simulation for the 217 × 217 GHz Planck frequency, featuring varying scatter scenarios, each represented by distinct colors, as detailed in the legend. The top panels display the raw power spectra, while the bottom panels depict the power spectrum ratios relative to the “no scatter” case in linear scale. Left: the clustering component of the power spectrum. Right: the shot-noise component.
Current usage metrics show cumulative count of Article Views (full-text article views including HTML views, PDF and ePub downloads, according to the available data) and Abstracts Views on Vision4Press platform.
Data correspond to usage on the plateform after 2015. The current usage metrics is available 48-96 hours after online publication and is updated daily on week days.
Initial download of the metrics may take a while.