Fig. 10.
Download original image
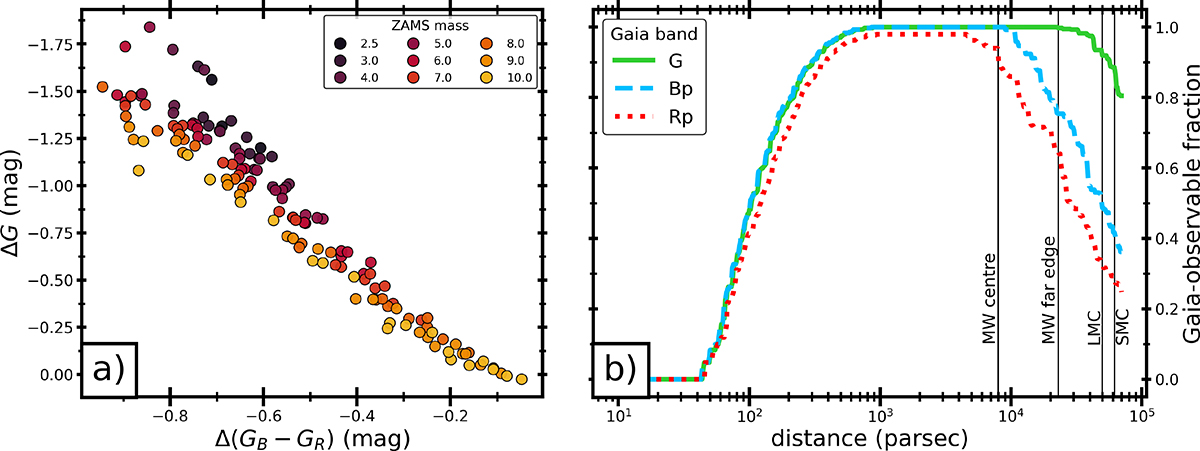
Chromatic evolution of the DDI binaries during their phase of rapid brightening in the Gaia bands. Panel a shows the change in Gaia magnitude and colour during this phase, with the origin representing the point of minimum luminosity. The colours denote the ZAMS mass of the donors, as in the legend. Panel b shows the fraction of DDI binaries for which photometric changes are expected to be detectable by Gaia as a function of distance –neglecting effects of extinction– in each Gaia photometric band, coloured accordingly as in the legend. The vertical black lines indicate, from left to right, the approximate distance to the galactic centre, the far edge of the Milky Way (based on its D25-isophotal diameter Goodwin et al. 1998), and the large and small Magellanic clouds.
Current usage metrics show cumulative count of Article Views (full-text article views including HTML views, PDF and ePub downloads, according to the available data) and Abstracts Views on Vision4Press platform.
Data correspond to usage on the plateform after 2015. The current usage metrics is available 48-96 hours after online publication and is updated daily on week days.
Initial download of the metrics may take a while.