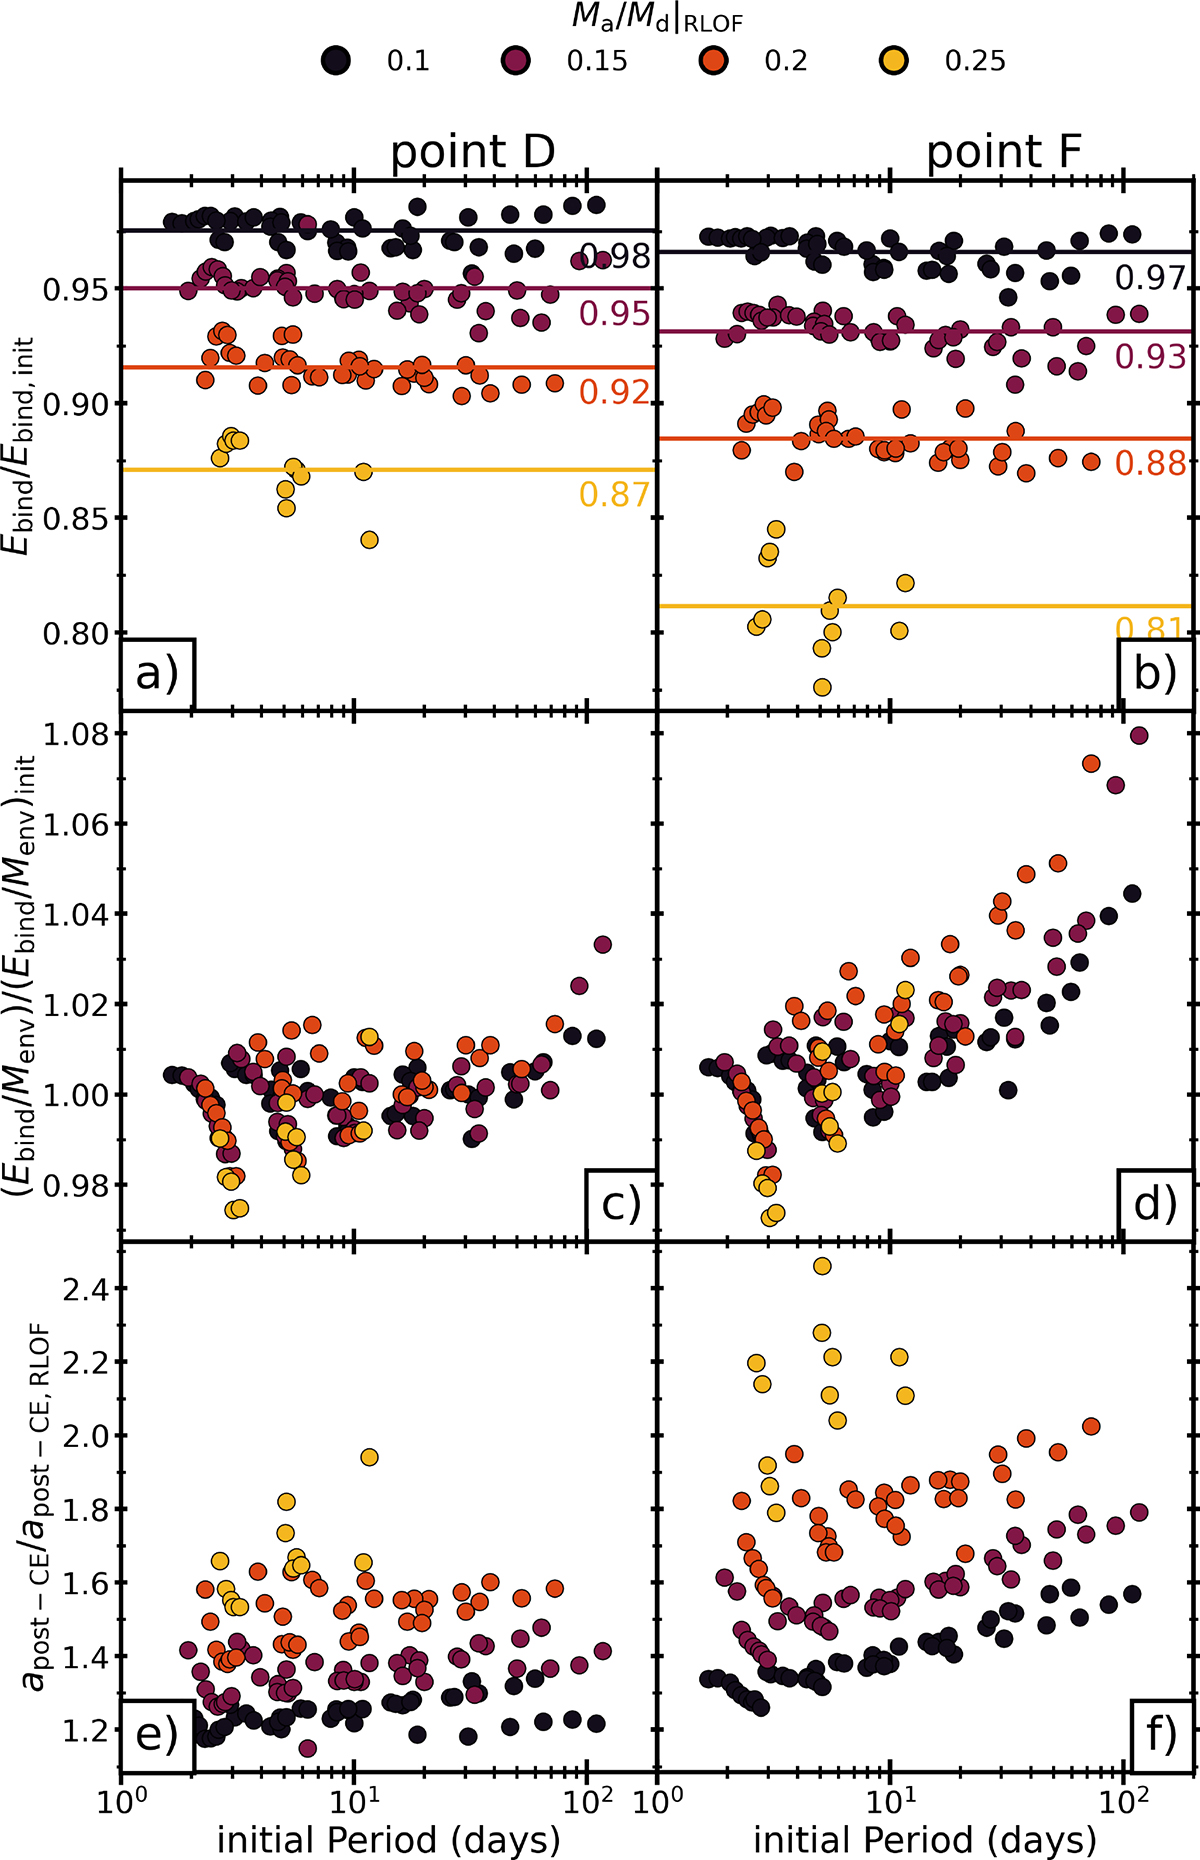
Fig. A.2.
Download original image
Similar to Figure A.1. Panels a and b show the binding energy of the envelope of the donor stars relative to the onset of RLOF, panels d and d show the specific binding energy relative to the onset of RLOF and panels e and f show the post-CE orbital separation calculated using binary properties at points D and F relative to to the post-CE separation calculated using the properties at RLOF.
Current usage metrics show cumulative count of Article Views (full-text article views including HTML views, PDF and ePub downloads, according to the available data) and Abstracts Views on Vision4Press platform.
Data correspond to usage on the plateform after 2015. The current usage metrics is available 48-96 hours after online publication and is updated daily on week days.
Initial download of the metrics may take a while.