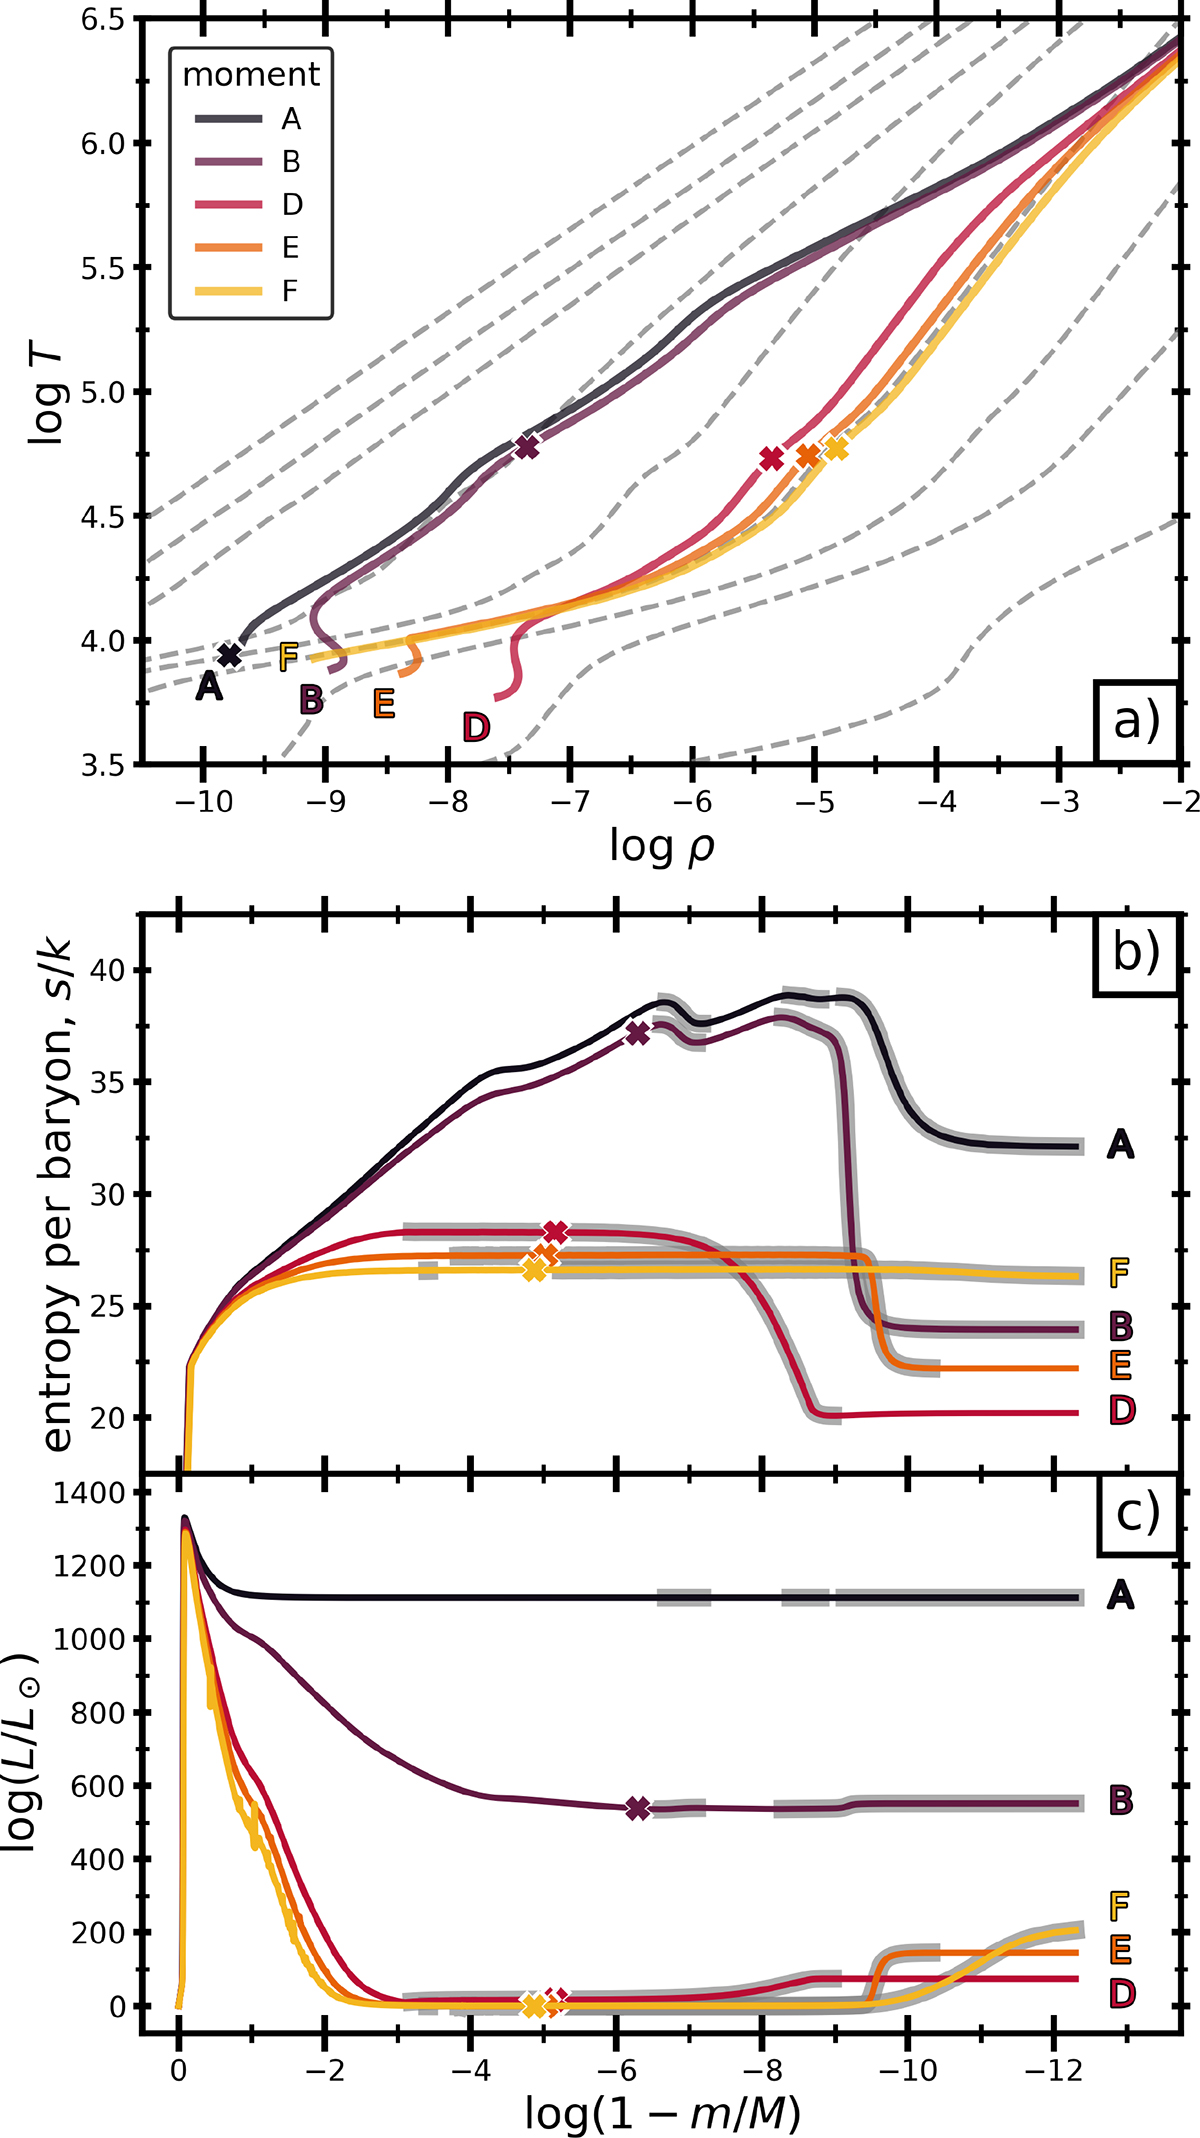
Fig. 3.
Download original image
Structural changes in the donor star of the same representative DDI system as in Figures 1 and 2. Panel a shows the structure of the donor star in the logρ − logT (in cgs units) plane at different moments in the evolution. Panels b and c show how, respectively, the specific entropy (per baryon) and internal luminosity vary throughout the donor star, using the fractional exterior mass as horizontal coordinate. In panel a, gray dashed lines correspond to adiabats. In panels b and c, gray shading indicates where the star is convective. In all panels, the lines are coloured and labelled according to the moments in the legend (see also Table 1). Crosses indicate the location of the Roche lobe equivalent volume radius inside the star.
Current usage metrics show cumulative count of Article Views (full-text article views including HTML views, PDF and ePub downloads, according to the available data) and Abstracts Views on Vision4Press platform.
Data correspond to usage on the plateform after 2015. The current usage metrics is available 48-96 hours after online publication and is updated daily on week days.
Initial download of the metrics may take a while.