Fig. 4.
Download original image
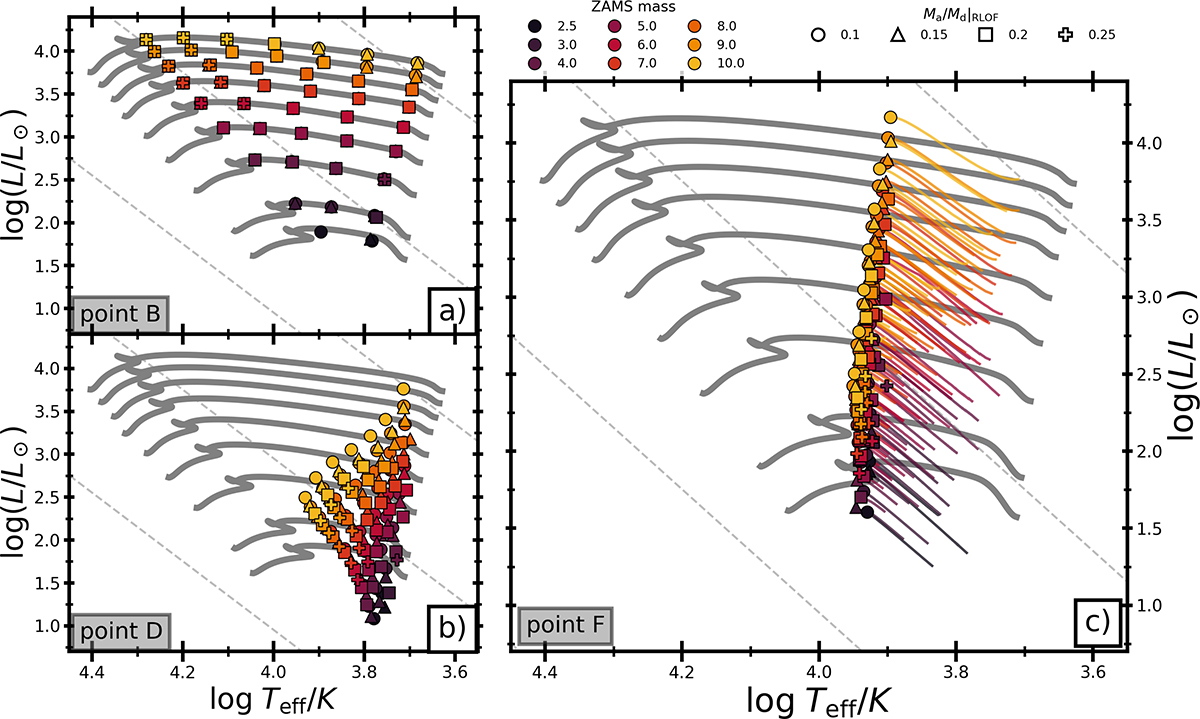
HRD locations of all our models at point B (the onset of RLOF; panel a), point D (the luminosity minimum; panel b), and point F (near-complete adiabatic stratification of the envelope; panel c). In all panels, the data points are coloured according to the corresponding initial donor mass and the marker type reflects the initial mass ratio, as indicated in the legend. Panel c furthermore shows the HRD tracks of the donor stars during the 10 years preceding point F.
Current usage metrics show cumulative count of Article Views (full-text article views including HTML views, PDF and ePub downloads, according to the available data) and Abstracts Views on Vision4Press platform.
Data correspond to usage on the plateform after 2015. The current usage metrics is available 48-96 hours after online publication and is updated daily on week days.
Initial download of the metrics may take a while.