Fig. 7.
Download original image
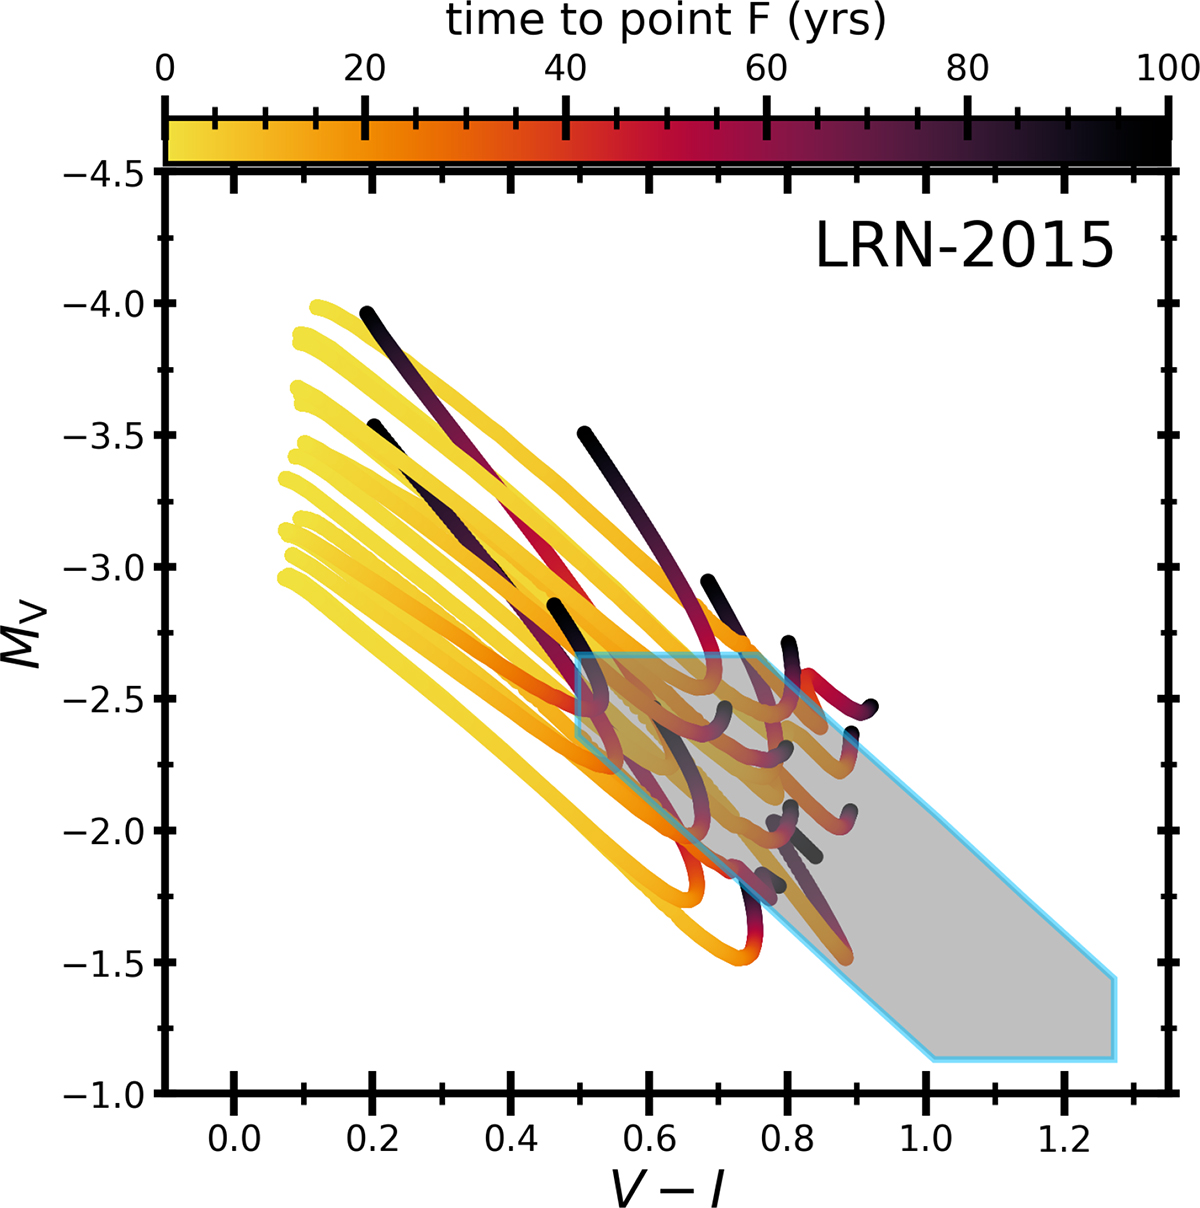
Colour-magnitude diagram track of DDI progenitor models for the 2015 LRN outburst in M31. The grey region with blue outline represents the observational uncertainties of the progenitor star, which include the distance modulus error, measurement error, and extinction uncertainty. The coloured lines show the CMD tracks of matching DDI models (which include the approximated companion photometry) during the last century before point F. The colours represent the time from any given point on the track to point F as indicated in the colour bar.
Current usage metrics show cumulative count of Article Views (full-text article views including HTML views, PDF and ePub downloads, according to the available data) and Abstracts Views on Vision4Press platform.
Data correspond to usage on the plateform after 2015. The current usage metrics is available 48-96 hours after online publication and is updated daily on week days.
Initial download of the metrics may take a while.