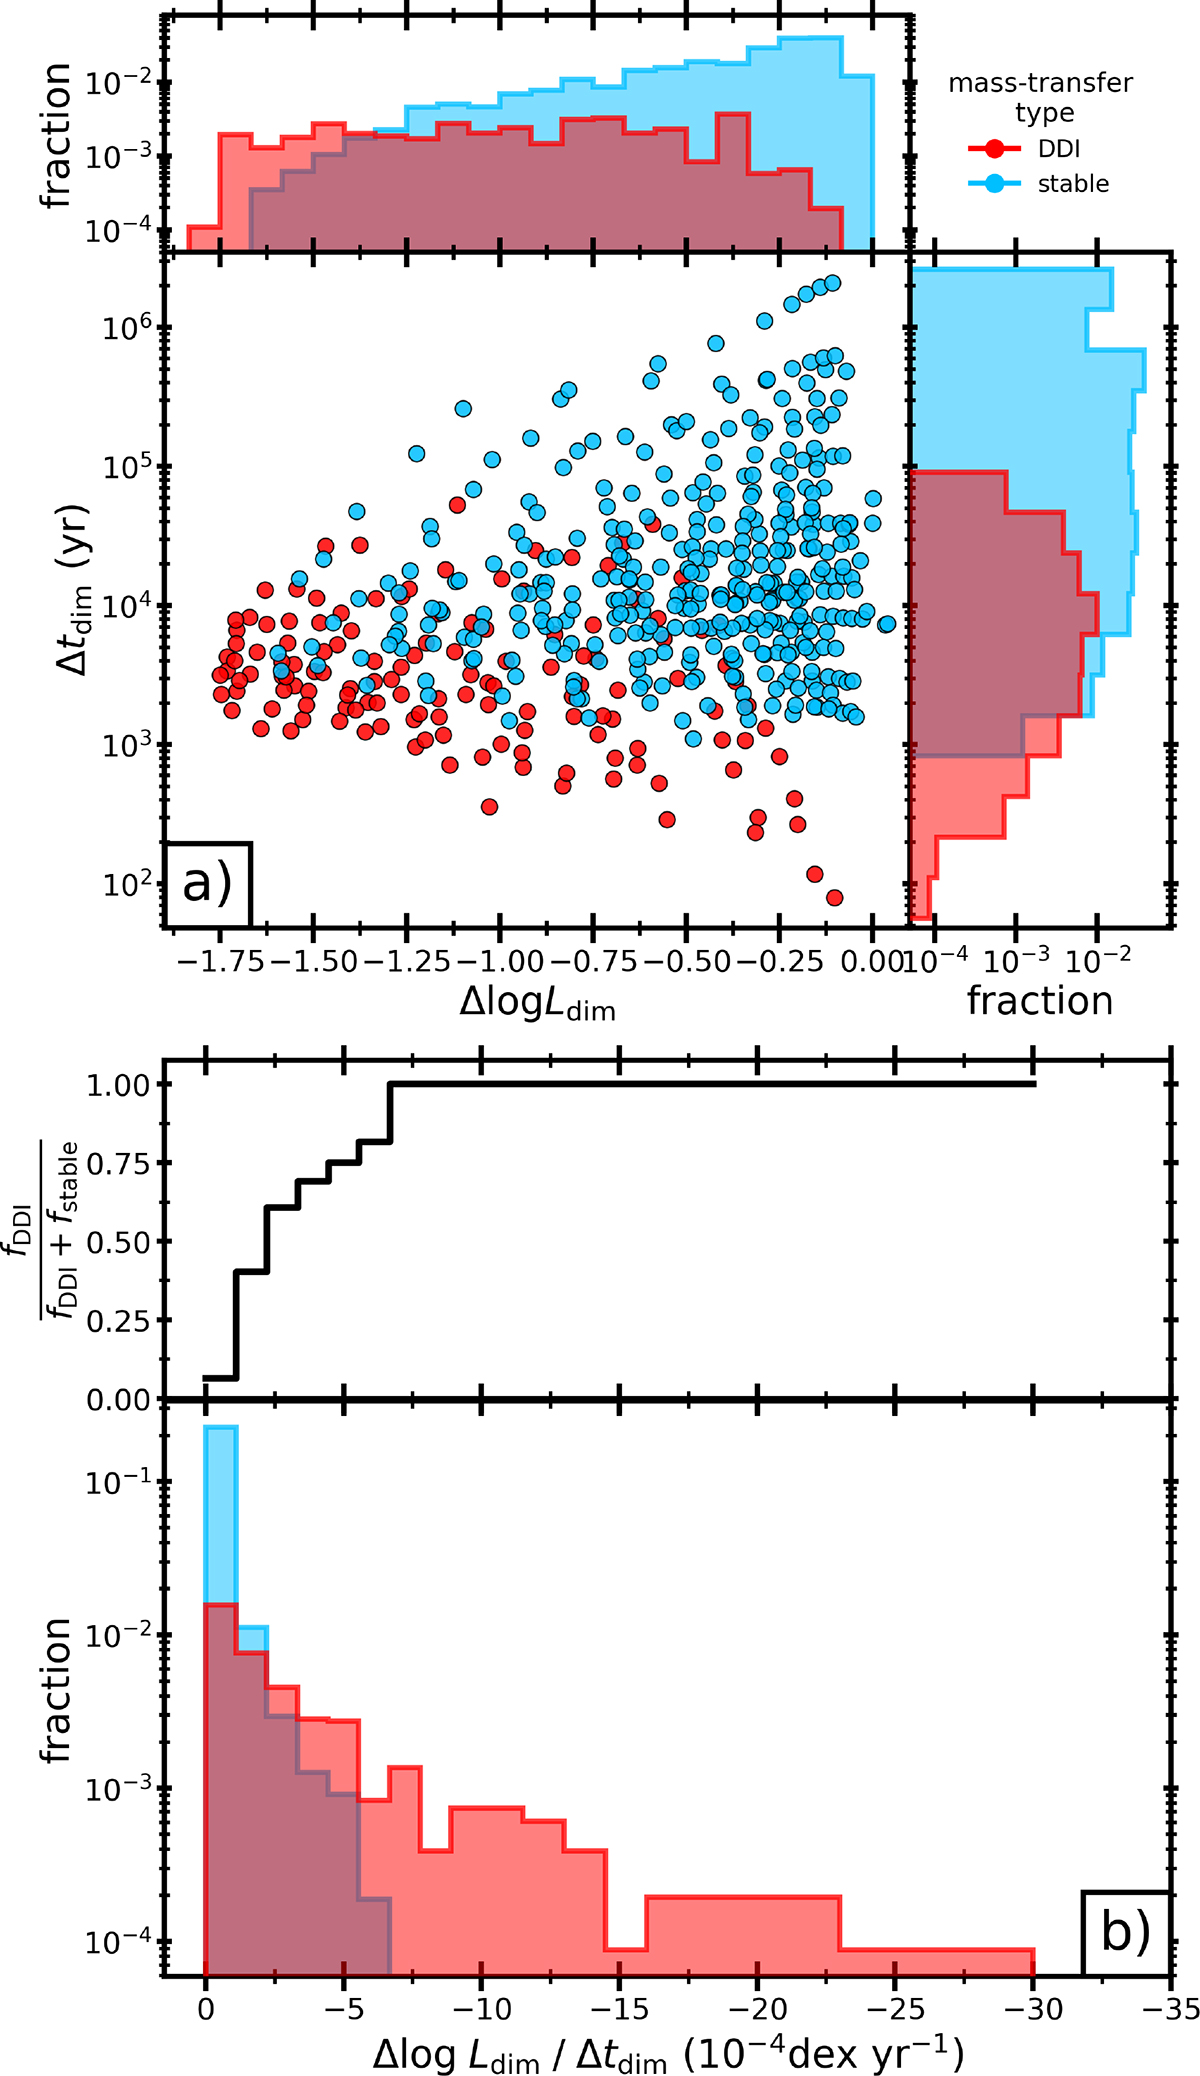
Fig. 8.
Download original image
Photometric evolution of the binaries (donor and accretor luminosities combined) in our synthetic sample during their phase of slow dimming. Properties relating to DDI binaries are shown in red, and those relating to stable mass-transfer binaries are shown in blue, as in the legend. The ‘fraction’ label on the distributions refers to a fraction out of all stars with 2.5 ≤ Md/M⊙ ≤ 10. Subfigure a shows the change in luminosity during this phase plotted against the corresponding dimming evolution time. Subfigure b shows the distribution of the resulting dimming rates in the bottom panel, and the ratio of DDI binaries to all binaries as a function of dimming rate in the top panel.
Current usage metrics show cumulative count of Article Views (full-text article views including HTML views, PDF and ePub downloads, according to the available data) and Abstracts Views on Vision4Press platform.
Data correspond to usage on the plateform after 2015. The current usage metrics is available 48-96 hours after online publication and is updated daily on week days.
Initial download of the metrics may take a while.