Fig. 3.
Download original image
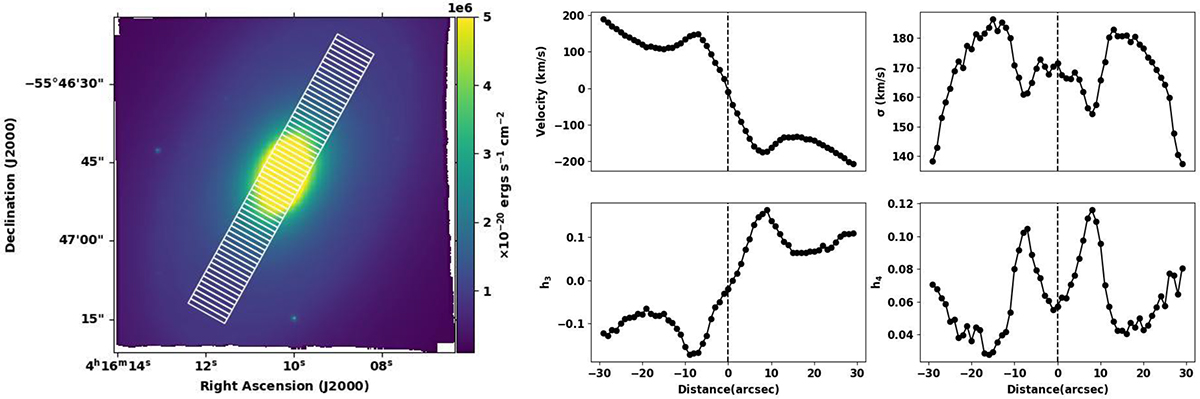
1D radial profiles from the corresponding 2D maps. Left: intensity map of NGC 1553 constructed using a MUSE datacube over the wavelength range 480–580 nm. To extract the 1D profiles, we employed a rectangular pseudo-slit of width 8 arcsec and a step size of 1 arcsec along its length. Right: 1D radial profile of V (a), σ (b), h3 (c), and h4 (d) along the white rectangular pseudo-slit as shown on the left panel. The vertical dashed line in each profile signifies the position of the central slit. Typical median errors are Verr ∼ 6.1 km s−1, σerr ∼ 8.1 km s−1, h3, err ∼ 0.028, and h4, err ∼ 0.033.
Current usage metrics show cumulative count of Article Views (full-text article views including HTML views, PDF and ePub downloads, according to the available data) and Abstracts Views on Vision4Press platform.
Data correspond to usage on the plateform after 2015. The current usage metrics is available 48-96 hours after online publication and is updated daily on week days.
Initial download of the metrics may take a while.