Open Access
Fig. 4.
Download original image
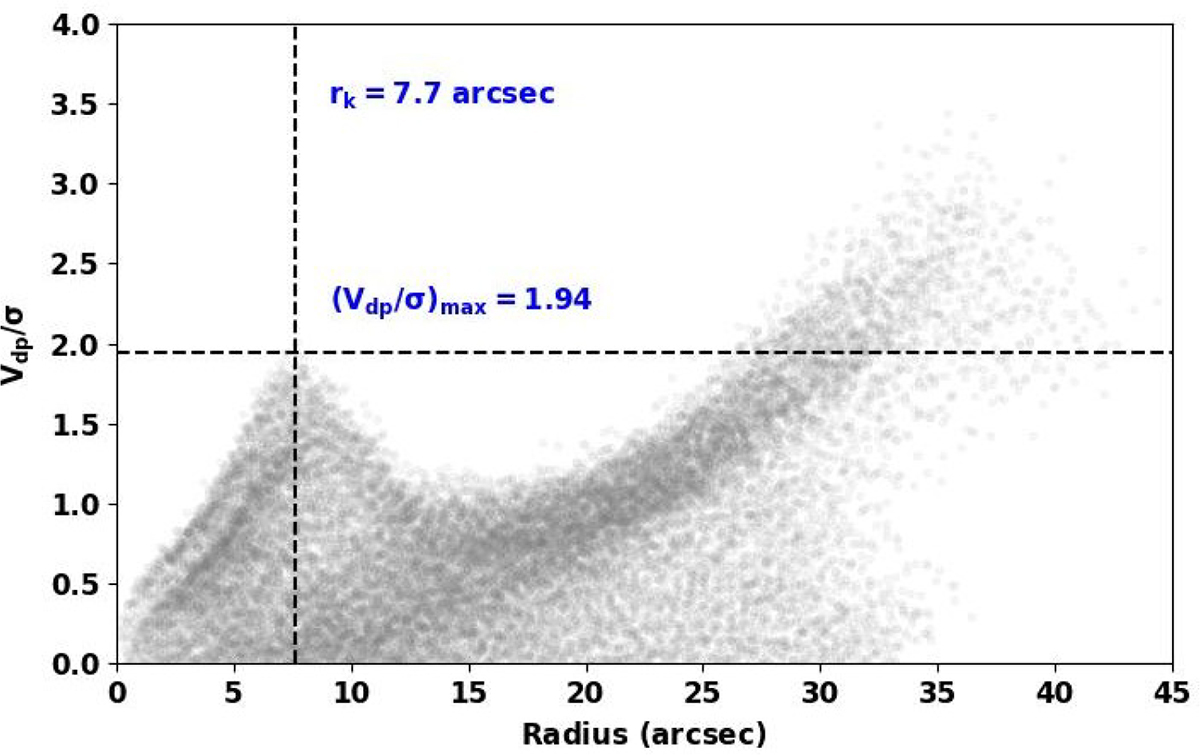
Deprojected radial profiles of V/σ at each Voronoi bin, with velocity (V) corrected for inclination. The peak value Vdp/σ and the radius at which this peak is located (rk) are shown with the horizontal and vertical dashed lines, respectively, and the corresponding values are given.
Current usage metrics show cumulative count of Article Views (full-text article views including HTML views, PDF and ePub downloads, according to the available data) and Abstracts Views on Vision4Press platform.
Data correspond to usage on the plateform after 2015. The current usage metrics is available 48-96 hours after online publication and is updated daily on week days.
Initial download of the metrics may take a while.