Fig. 1
Download original image
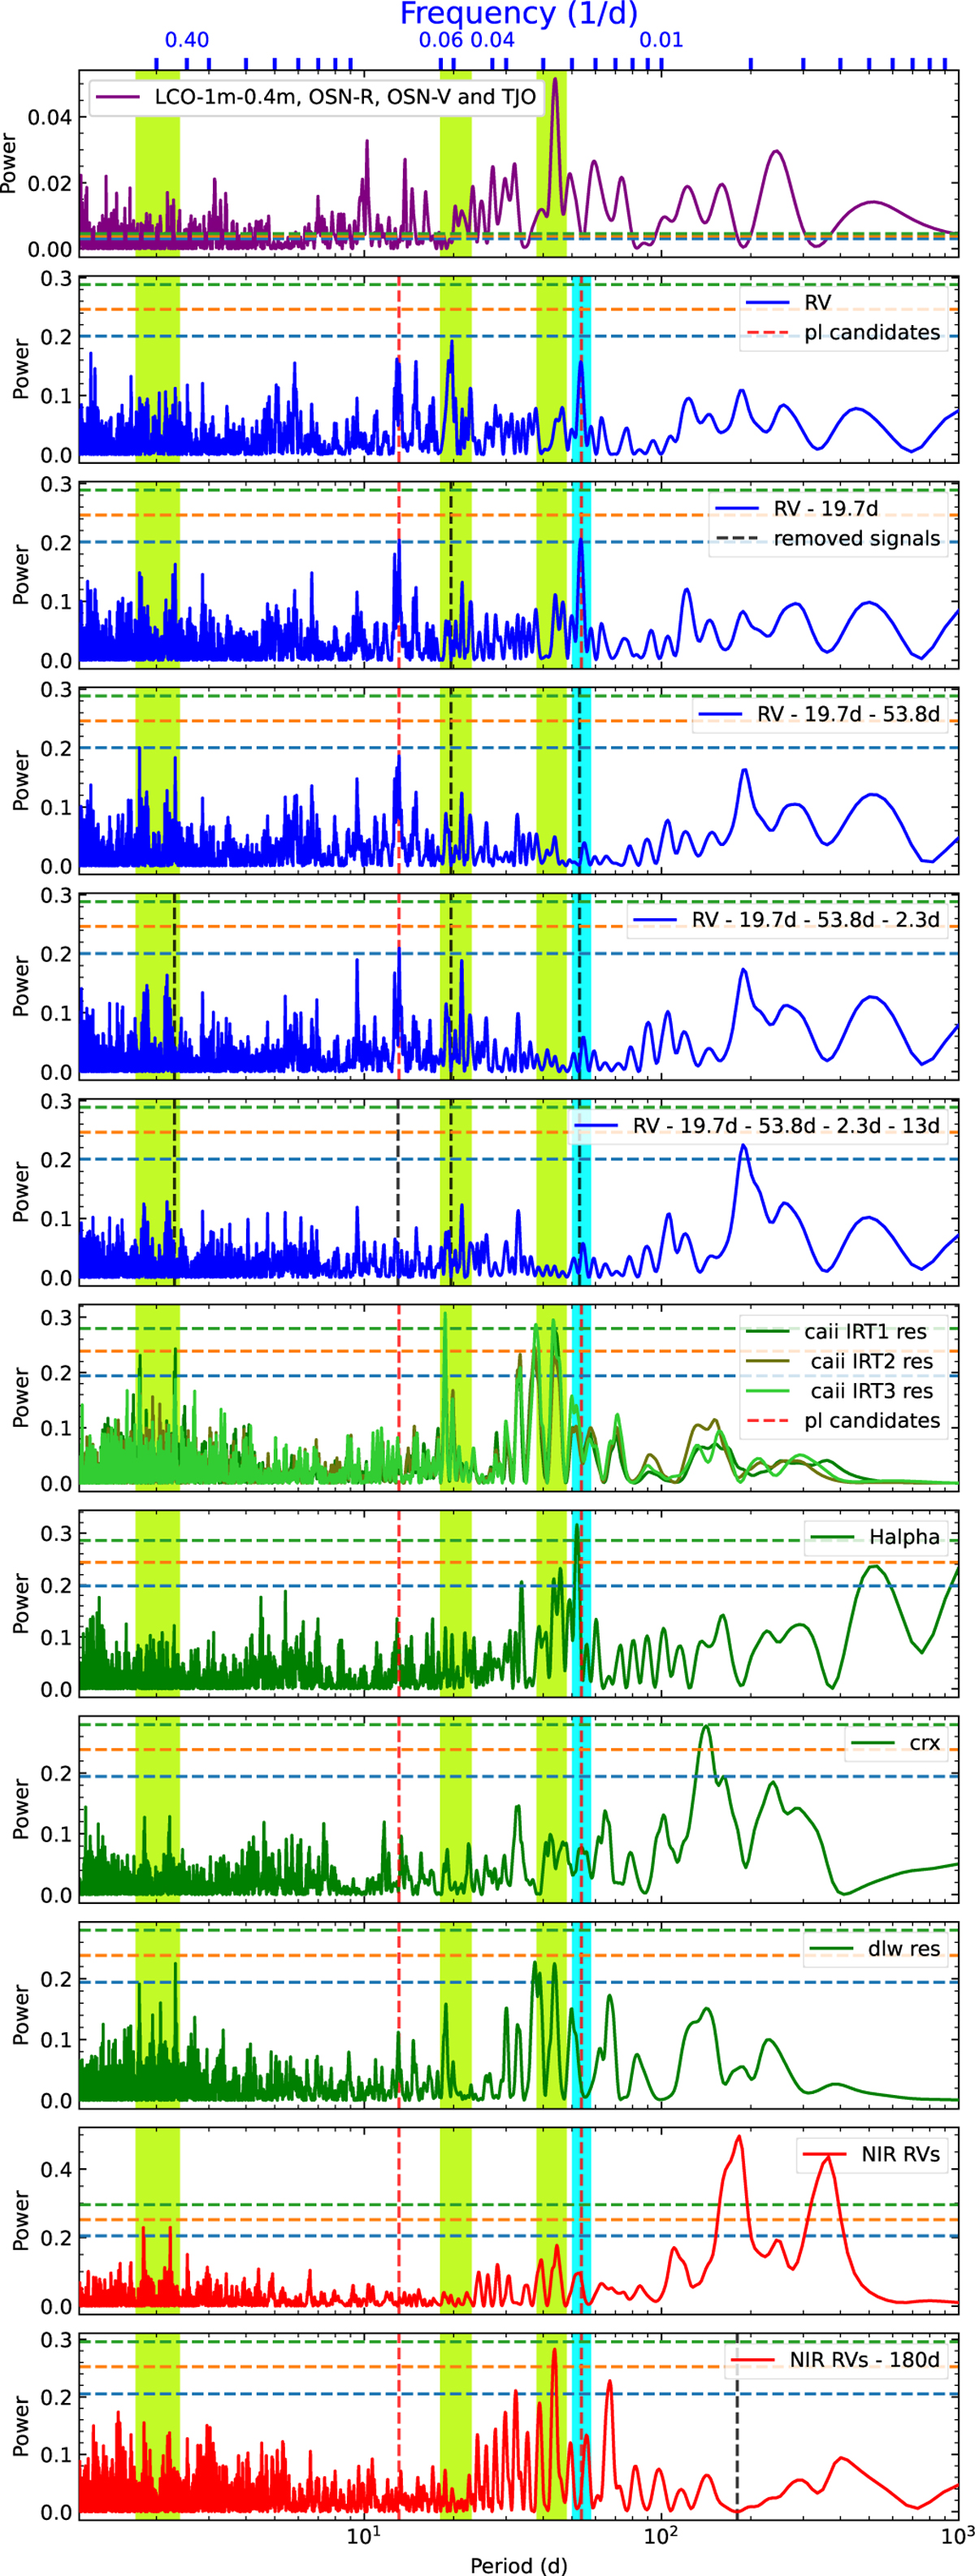
GLS periodograms of all photometric and spectroscopic data. Vertical dashed lines mark planetary orbital periods (transiting planet on a cyan band), and vertical green bands indicate stellar activity timescales (see text). Horizontal dashed lines show FAP levels (0.1% in green, 1% in orange, and 10% in blue) across all panels.
Current usage metrics show cumulative count of Article Views (full-text article views including HTML views, PDF and ePub downloads, according to the available data) and Abstracts Views on Vision4Press platform.
Data correspond to usage on the plateform after 2015. The current usage metrics is available 48-96 hours after online publication and is updated daily on week days.
Initial download of the metrics may take a while.