Open Access
Fig. A.12
Download original image
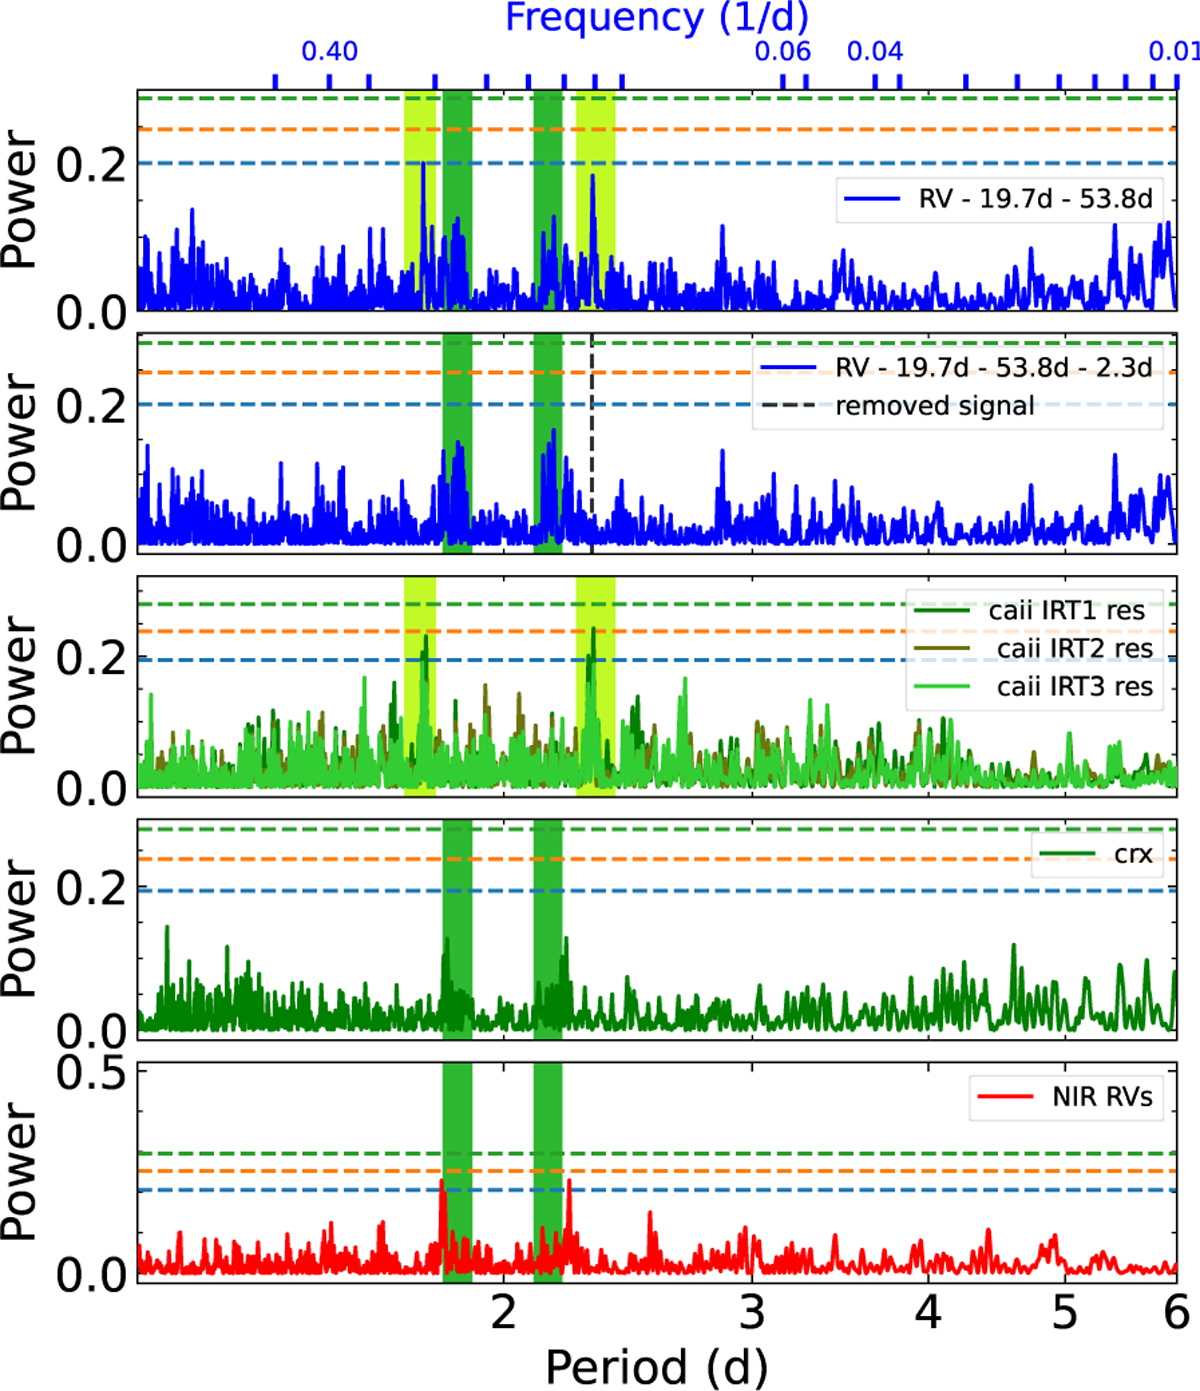
GLS periodogram as in Fig. 1, focused on the region around 2 d for different indicators. Light green bands indicate periodicities detected as spectroscopic and photometric signs of stellar activity. Dark green bands indicate periodicities detected in the VIS RV data, and possibly related to a planet (see Sect. 5.3).
Current usage metrics show cumulative count of Article Views (full-text article views including HTML views, PDF and ePub downloads, according to the available data) and Abstracts Views on Vision4Press platform.
Data correspond to usage on the plateform after 2015. The current usage metrics is available 48-96 hours after online publication and is updated daily on week days.
Initial download of the metrics may take a while.