Fig. 1
Download original image
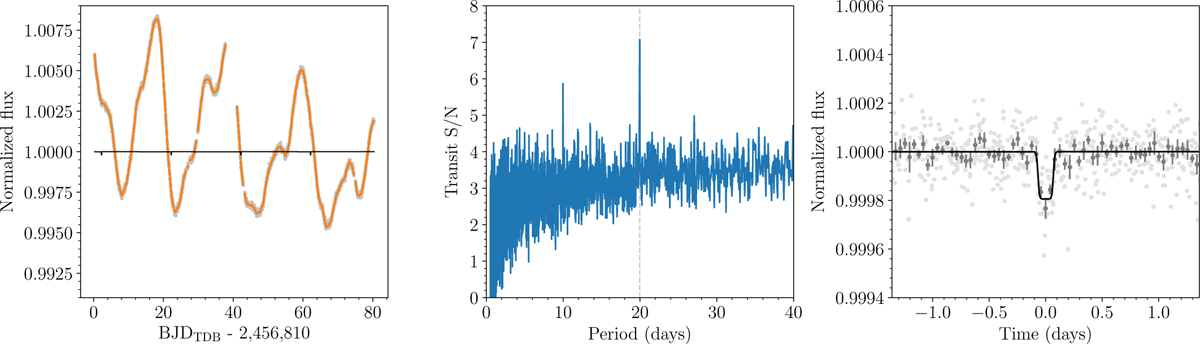
Detection of the candidate planet e. Left: gray data points represent the K2 data without the transits of planets b, c, and d. The orange data points show the mean GP model. The black light curve indicates the four transits we found. Center: periodogram of the nuance algorithm. Right: phased light curve without the noise model (gray points), binned (dark gray), and transit model (black line).
Current usage metrics show cumulative count of Article Views (full-text article views including HTML views, PDF and ePub downloads, according to the available data) and Abstracts Views on Vision4Press platform.
Data correspond to usage on the plateform after 2015. The current usage metrics is available 48-96 hours after online publication and is updated daily on week days.
Initial download of the metrics may take a while.