Fig. 10
Download original image
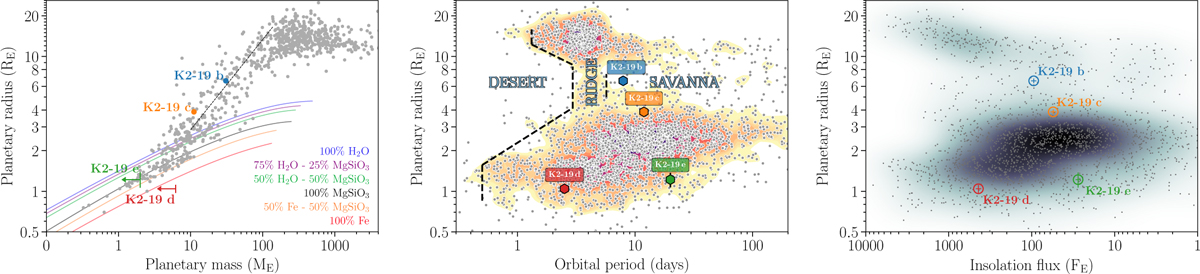
Comparison of the K2-19 planets with known exoplanets. Left: mass-radius diagram of known exoplanets. The gray dots show the transiting planets listed in the NASA Exoplanet Archive (https://exoplanetarchive.ipac.caltech.edu/, Akeson et al. 2013) with planetary radius and mass uncertainties below 20%. The dashed black line shows the sub-Neptune mass-radius relation from Parc et al. (2024). The solid lines represent theoretical models for different compositions (Zeng & Sasselov 2013). Center, idem for planetary radii vs. orbital period (restricted to planets with planetary radius uncertainties below 20%), with exo-Neptunian boundaries from Castro-González et al. (2024a). Right: idem for planetary radii vs. insolation flux. A Gaussian kernel density estimate is shown in different color intensities.
Current usage metrics show cumulative count of Article Views (full-text article views including HTML views, PDF and ePub downloads, according to the available data) and Abstracts Views on Vision4Press platform.
Data correspond to usage on the plateform after 2015. The current usage metrics is available 48-96 hours after online publication and is updated daily on week days.
Initial download of the metrics may take a while.