Fig. A.3
Download original image
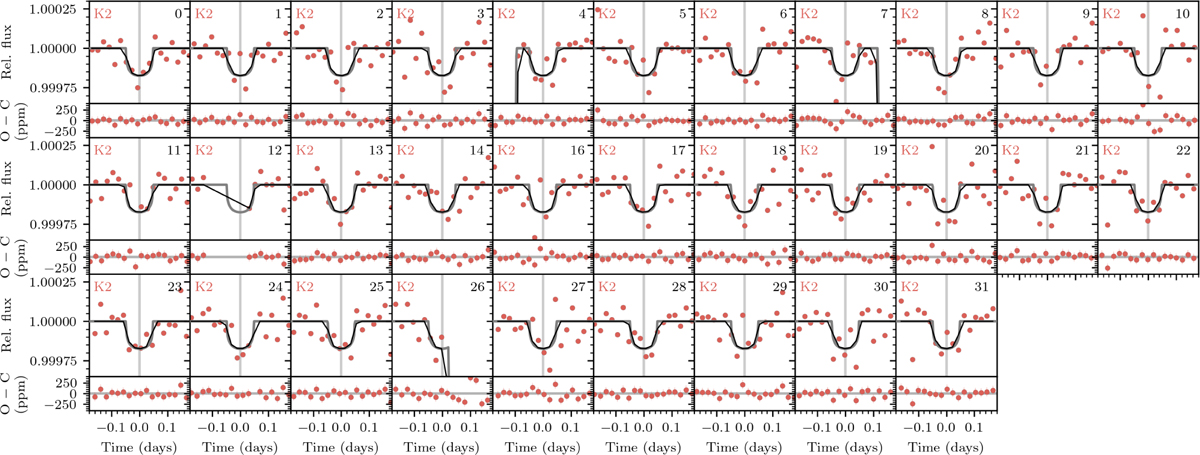
Noise-model-corrected transits of K2-19 d (dots with the same color code as in Fig. 2), the MAP model (black line), and the continuous oversampled MAP model (gray line) from the photodynamical modeling. Each panel is centered at the linear ephemeris (indicated by the vertical gray lines). Each panel is labeled with the telescopes that observed and the epoch number. The residuals after subtracting the MAP model are shown in the lower part of each panel.
Current usage metrics show cumulative count of Article Views (full-text article views including HTML views, PDF and ePub downloads, according to the available data) and Abstracts Views on Vision4Press platform.
Data correspond to usage on the plateform after 2015. The current usage metrics is available 48-96 hours after online publication and is updated daily on week days.
Initial download of the metrics may take a while.