Fig. A.7
Download original image
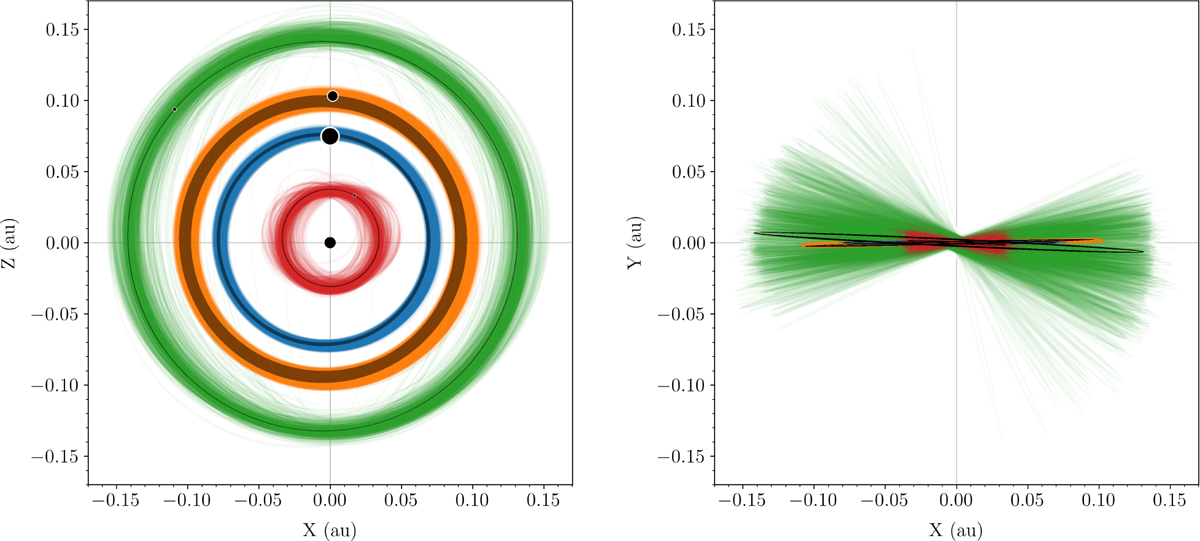
Orbital projections for the time-span covered by the observations. The origin is the system barycenter, and the orbits are projected in the X-Z plane (left panel, system top view, movement is clockwise, the positive Z-axis points towards the observer) and in the sky plane seen by the observer (X-Y, right panel). A thousand random orbits were drawn from the posterior samples, and the MAP is shown as a gray orbit. In the left panel, the black circles mark the position of the star (size to scale) and the planets (enlarged by a factor of 20) at tref for the MAP.
Current usage metrics show cumulative count of Article Views (full-text article views including HTML views, PDF and ePub downloads, according to the available data) and Abstracts Views on Vision4Press platform.
Data correspond to usage on the plateform after 2015. The current usage metrics is available 48-96 hours after online publication and is updated daily on week days.
Initial download of the metrics may take a while.