Fig. C.1
Download original image
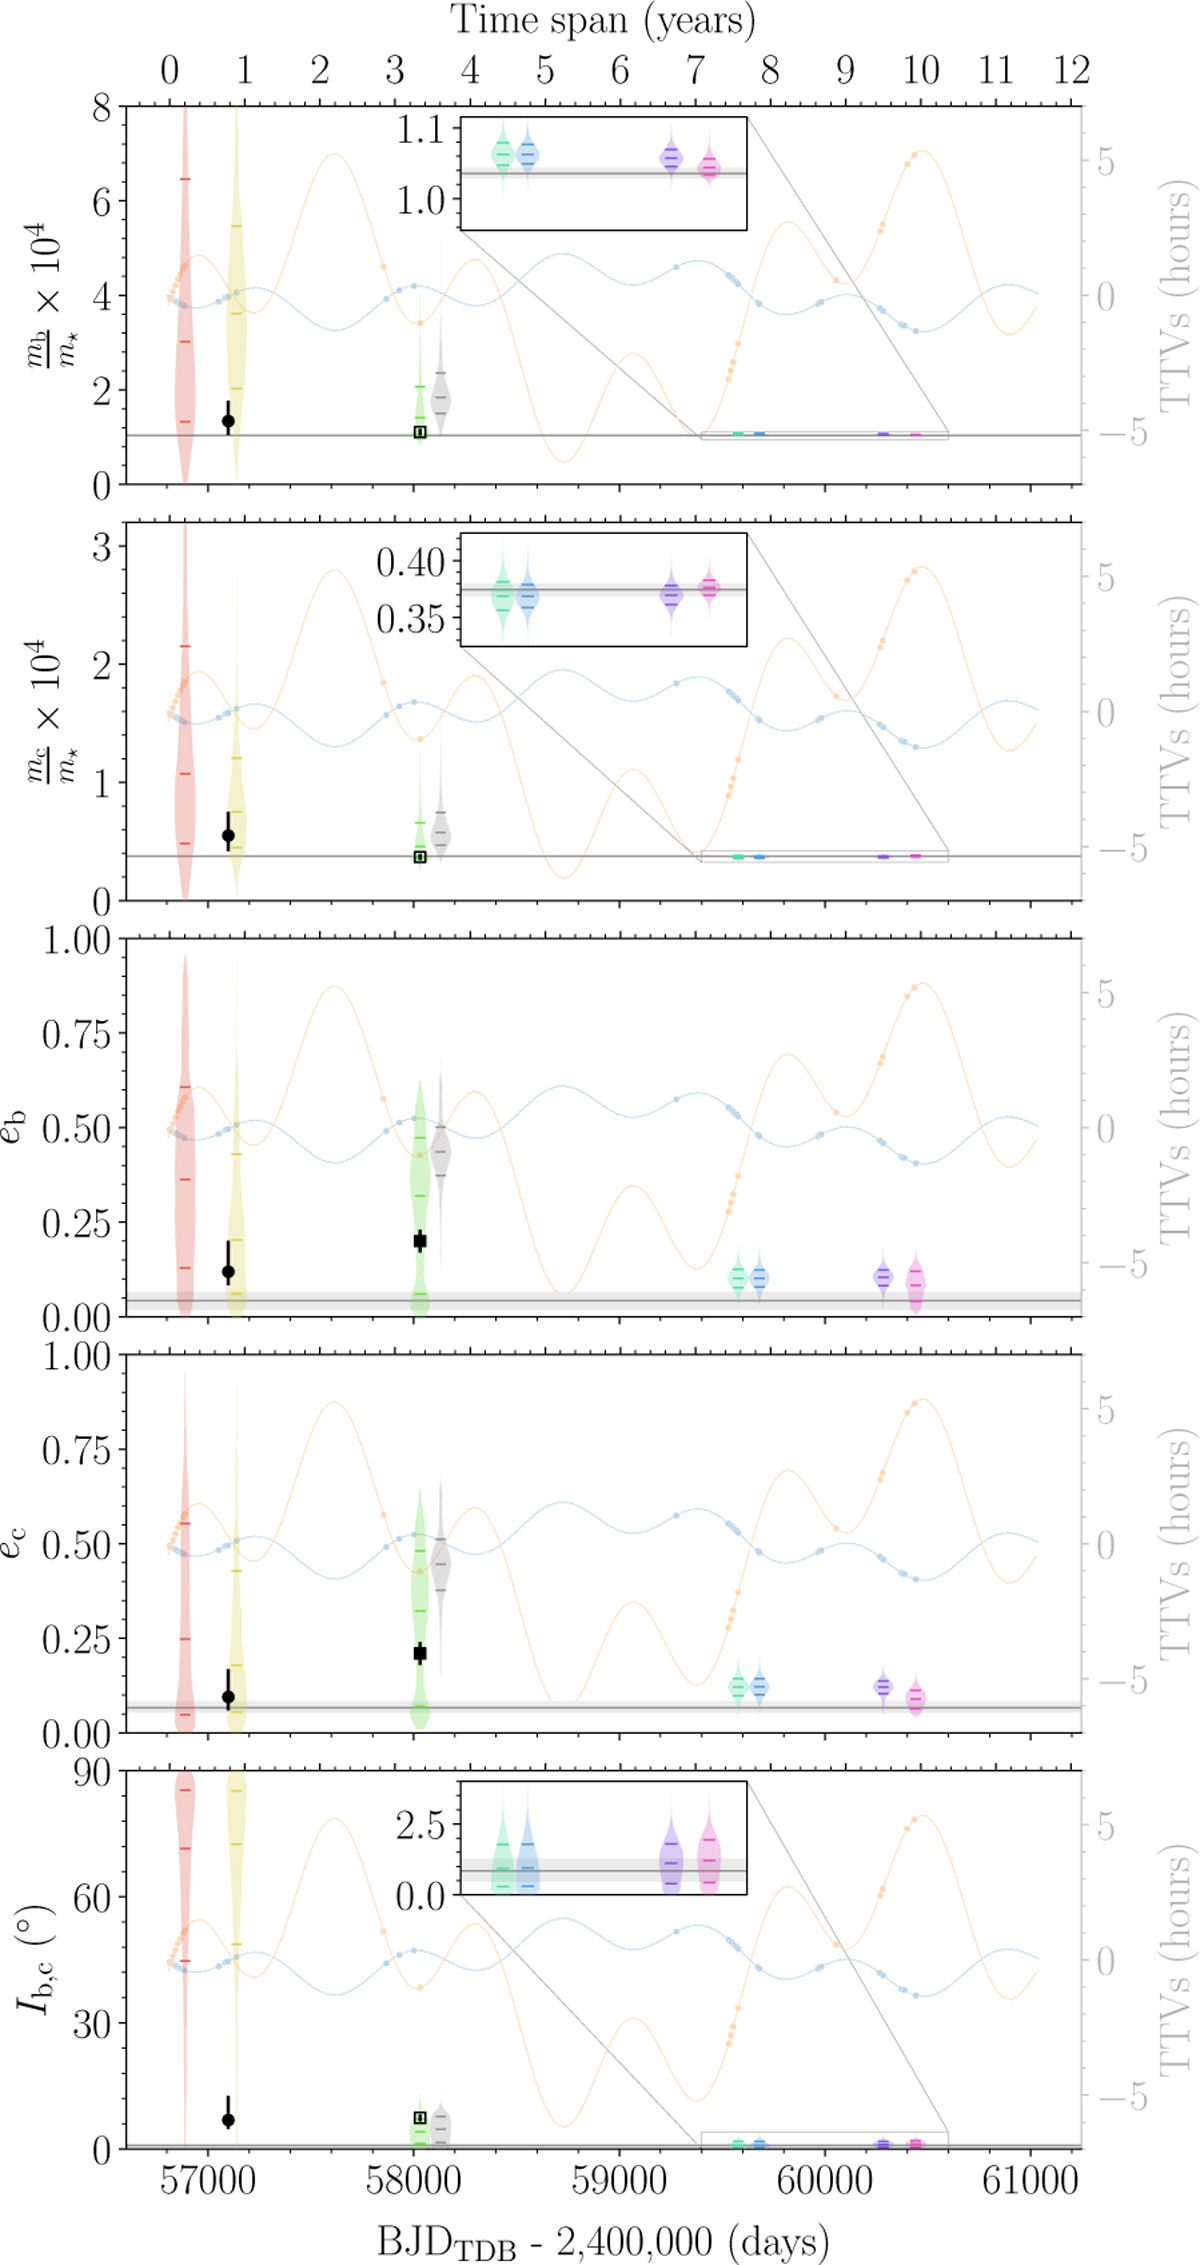
Comparison of the marginal posterior distribution (violins) of selected parameters (orbital parameters are at tref) for the analysis of the transit times with different time spans. Violins are positioned at the time of the last observation considered in the analysis and horizontal ticks inside them marks the median and 68.3% CI of the marginal posterior distribution. The gray violins corresponds to the 2017 dataset using the LCOGT timing from Petigura et al. (2020) and are offset to the right for clarity. The horizontal line and gray band represent the median and 68.3% CI of the marginal posterior distribution from the photodynamical analysis of Sect. 4.2. The insets provide a zoomed view of the last four transit timing analyses. Results from the photodynamical analysis of Barros et al. (2015) are shown with black circle error bars, and those of Petigura et al. (2020) with black square error bars (open squares correspond to derived values assuming normal distributions for the quoted parameters, and thus do not account for correlations between them). In the background, the median posterior TTVs for planets b (light blue) and c (light orange) from the photodynamical analysis of Sect. 4.2 are shown, and dots mark the observed transits.
Current usage metrics show cumulative count of Article Views (full-text article views including HTML views, PDF and ePub downloads, according to the available data) and Abstracts Views on Vision4Press platform.
Data correspond to usage on the plateform after 2015. The current usage metrics is available 48-96 hours after online publication and is updated daily on week days.
Initial download of the metrics may take a while.